What is linearity for pressure sensor?
Linearity refers to how accurately a sensor’s output voltage or current corresponds to the actual applied pressure in a straight line or linear fashion.
A linear sensor’s output will change by equal amounts for equal pressure changes across its entire range.
For example, a perfectly linear sensor with a 0-100 psi range would have:
- An output of 0 V at 0 psi pressure
- An output of 5 V at 50 psi pressure
- An output of 10 V at 100 psi pressure
This is because its output changes by 1 V for every 10-psi change in pressure in a straight proportional relationship.
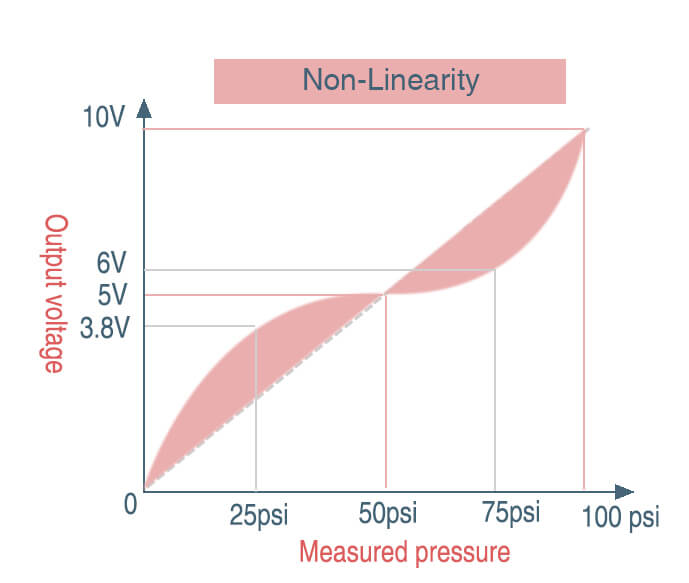
However, real pressure sensors are never perfectly linear. Non-linearity refers to the maximum deviation of a sensor’s actual output from this ideal straight-line response. It is typically specified as a percentage of full-scale output or pressure range.
For instance, a sensor might be rated for ±1% linearity. This means:
- Across its entire 0-100 psi range, the sensor’s actual output will deviate by no more than ±1% from the ideal straight-line response.
- At 50 psi, the output could be anywhere between 4.95V and 5.05V and still meet the ±1% specification.
The lower the non-linearity percentage, the more accurately the sensor’s output matches an ideal straight line proportional to pressure. This ensures accurate readings across the sensor’s full measuring range.
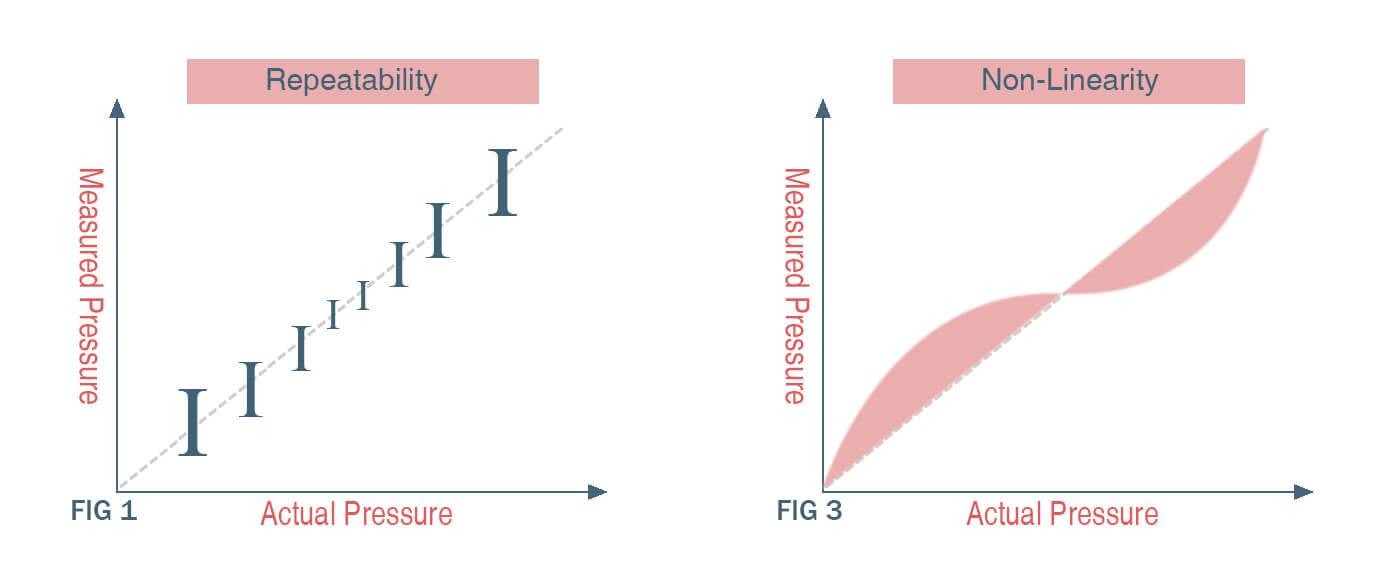
What is the difference between linearity and repeatability?
Linearity and repeatability are two important specifications for pressure sensors that describe different aspects of the sensor’s performance; however, they are different.
Linearity refers to how close the sensor’s output corresponds to the actual measured pressure in a straight-line fashion.
A linear sensor output means the sensor reading changes by the same amount for each equal increase in pressure.
Repeatability refers to how consistent the sensor readings are when the same pressure is applied multiple times.
An ideal repeatable sensor would give the exact same reading every time for a particular pressure value.
For example, say a sensor is rated for a 0 to 10 bar pressure range. An ideal linear sensor would output 0 to 100% of its reading over that range, increasing by 10% for every 1 bar of pressure. However, real sensors will deviate from this linear behavior to some degree.
The linearity specification denotes the maximum deviation from this ideal straight-line response, usually stated as a percentage of full-scale output. The lower the linearity percentage, the more linear the sensor is.
When it comes to repeatability if a sensor is subjected to 5 bar pressure 10 separate times, a perfectly repeatable sensor would readout 5.000 bar each time. However, real sensors will show some variation in readings due to noise, hysteresis, etc.
The repeatability specification denotes the maximum deviation of readings at a given pressure over multiple cycles, usually stated as a percentage of full-scale output. The lower the repeatability percentage, the more repeatable the sensor.
How non-linearity affects the accuracy of pressure sensor reading?
Pressure sensors are designed to have an output that changes linearly with the applied pressure.
However, real sensors have some level of non-linearity in their response. This means the sensor output does not increase by exactly the same amount for each equal pressure change but deviates from the ideal linear response.
The sensor may read higher or lower than the actual pressure at any given pressure value due to its non-linear response. The amount of deviation depends on the sensor’s non-linearity specification.
For example, if a sensor has 2% non-linearity and needs to read 10 bar pressure, it may actually read between 9.8 bar to 10.2 bar. The higher the non-linearity, the wider this deviation and the lower the accuracy.
The error due to non-linearity also changes with pressure. The sensor may read values accurately at some pressures but deviate more at others, depending on its non-linear response curve.
Non-linearity causes the sensor’s readings to deviate from the actual pressures in non-uniform and unpredictable ways. This results in lower accuracy and increased error in the sensor measurements. The lower the sensor’s non-linearity specification, the smaller these effects and the higher its measurement accuracy.
How do manufacturers ensure that pressure sensors have good linearity?
The precise initial sensor design optimized for linearity, along with strict production controls and multi-point calibration across the measuring range are the most critical factors that help manufacturers ensure good linearity in their pressure sensors.
Let talk step by step:
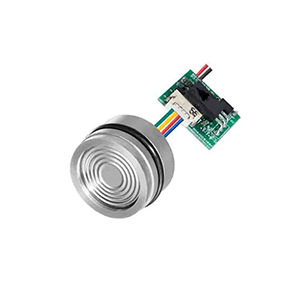
- Precision sensor design – This is the most important factor. The type of sensing element, materials, sealing technologies and electronics are designed to maximize linearity from the beginning. Piezoresistive and strain gauge sensors tend to have better inherent linearity compared to capacitive sensors.
The material used for the flexible sensing diaphragm can affect how linearly it deflects under pressure. Materials like silicon, ceramic and metal foil are chosen for their good linear deflection properties.
- Strict production controls – Tight manufacturing tolerances and process controls are put in place to minimize variation that can cause non-linearity.
Very tight manufacturing tolerances are maintained for all sensor components and during assembly. This includes precisely controlling dimensions like diaphragm thickness, seal flatness, and location of sensing elements. Maintaining tolerances within ±1% or less can significantly improve linearity.
- Advanced calibration techniques – Many high-end sensors undergo multi-point calibration, measuring and adjusting at 3, 5 or more pressure points across the range. This allows any non-linearities to be electronically compensated for, resulting in a near-perfect straight-line response.
As an example, In Eastsensor, you can find below the linearity specifications for some common pressure sensor types we have
- – Basic piezoresistive sensor: 0.5%- 1% of full scale
- – Precision piezoresistive sensor: 0.25% of full scale
- – Basic MEMS sensor: 2-3% of full scale
- – Precision MEMS sensor: 0.5% of full scale
The tighter the manufacturing controls and calibration techniques used, the better the linearity that can be achieved – often down to 0.1% for the highest-performance sensors.
The common cause of on-linearity of pressure sensors
1, Diaphragm non-uniformity
Any non-uniformity in the thickness or material properties of the flexible sensing diaphragm can cause it to deflect in a non-linear manner under pressure. This is a major source of non-linear output response.
In a pressure sensor, the flexible diaphragm deflects when pressure is applied. This deflection is detected by the sensor’s sensing elements to produce an electrical output.
For the sensor output to change linearly with pressure – meaning equal pressure changes produce equal output changes – the diaphragm must deflect in a linear fashion.
However, non-uniformity in the diaphragm can cause it to deflect in a non-linear manner, resulting in a non-linear sensor output response.
There are a few ways the diaphragm can be non-uniform:
- Thickness variations – If the diaphragm has areas that are thicker or thinner, they will deflect differently under the same pressure. This causes the overall deflection to become non-linear.
- Material properties – Variations in the diaphragm material’s stiffness, modulus, fatigue resistance etc. across its surface lead to non-linear deflection.
- Residual stress – Uneven residual stresses locked inside the diaphragm material during manufacturing also change how different areas deflect.
- Defects – The presence of defects like pits, scratches or inclusions make some areas of the diaphragm deflect non-uniformly.
2, Component misalignment
Pressure sensors have several components on the flexible sensing diaphragm that are precisely positioned to detect the diaphragm’s deflection under pressure. These include:
- Sensing elements – Piezo resistors, capacitive plates or strain gauges that change electrical properties in response to diaphragm motion.
- Electrical connections – Wires or traces that connect the sensing elements to other sensor components.
The intended locations and orientations of these components are critical for the sensor to detect changes in pressure in a linear fashion. Even minor misalignments during sensor assembly can introduce errors and non-linearities.
For example, if piezo resistors intended to be located at the center of the diaphragm are instead placed slightly off-center:
- They will experience different amounts of strain for the same pressure change, leading to inconsistent resistance changes.
- Their distance from the diaphragm’s fulcrum will change, altering their sensitivity to deflection.
- They may detect deflection non-uniformities caused by other factors like diaphragm thickness variations.
3, Hysteresis
Hysteresis refers to the phenomenon where a sensor’s output does not retrace the same path when the input pressure changes direction. For example, when increasing then decreasing the pressure:
- The sensor’s output may be slightly higher on the decreasing pressure curve compared to the initial increasing curve at the same pressure value.
- The degree of hysteresis can also change at different pressure ranges.
This behavior causes the sensor response to become “bowed” or “curved” rather than a straight line, resulting in non-linear output.
As a result, hysteresis limits the sensor’s accuracy and linearity performance. The amount of hysteresis determines the degree of non-linearity in the sensor’s output.
Take an example to clarify linearity.
Let’s consider a pressure sensor that is rated for 0 to 10 bar with an output of 0 to 5 V. An ideal linear sensor would output:
- 0 V at 0 bar pressure
- 5 V at 10 bar pressure
- Increase by 0.5 V for every 1 bar pressure rise
This means the sensor’s output changes by equal amounts for equal changes in pressure – the definition of linearity.
However, a real sensor may show some non-linearity in its response. For example:
- At 0 bar pressure, the sensor reads 0 V accurately.
- But at 3 bar pressure, it outputs 4.2 V instead of 3.75 V.
- At 6 bar pressure, it reads 4.7 V instead of 4.5 V.
- And at 10 bar pressure, it outputs 4.9 V instead of the ideal 5 V.
This shows the sensor has non-linearity in its response, deviating from the ideal straight line. The non-linearity increases with pressure.
To specify this non-linearity, the sensor datasheet would likely state:
Linearity: ≤2% of full scale
This means the maximum deviation of the sensor’s output from the ideal linear response is within ±2% of its 5V rating or ±0.1V.