Introduction
Temperature drift refers to the change in sensor output due to fluctuations in the ambient temperature.
It’s usually expressed in parts per million (ppm) per degree Celsius (°C).
For example, a sensor with a temperature drift of 50 ppm/°C would change its output by 0.005% for each degree Celsius change in ambient temperature.
This drift is primarily influenced by the materials used in the sensor construction, as they expand or contract with temperature changes, causing shifts in the sensor’s performance.
When evaluating the performance of pressure sensors, it’s crucial to consider temperature drift.
Varied temperature conditions can significantly impact the accuracy and reliability of the sensor readings. If a sensor has a high-temperature drift, it might give accurate readings at room temperature but deviate significantly in hotter or colder environments.
A minor deviation can lead to significant errors in critical applications such as medical devices, automotive systems, or industrial controls.
For instance, in a hydraulic pressure control system, a drift of just 1% could result in a pressure error of several hundred psi, potentially causing system failure.
Temperature drift = (Output at high temp – Output at calibration temp)/(Output at calibration temp)
For example, a sensor may exhibit +0.2% output change at 100°C compared to the calibration temperature of 20°C. This means the temperature drift is +0.2%.
Temperature drift can impact important performance parameters like:
| Parameter | Effect of Increased Temperature Drift | |
|---|---|---|
| 1 | Accuracy | Decreased accuracy over time |
| 2 | Sensitivity | Sensitivity may change over temperature |
| 3 | Response Time | Slower response due to material expansion |
| 4 | Hysteresis | Increased uncertainty due to residual stress |
| 5 | Non-linearity | More non-linear output with wider temperatures |
| 6 | Long-term Stability | Less stable measurements over years |
| 7 | Repeatability | Worse repeatability of measurements |
Temperature Drift and its Influence on Accuracy
The most common type of pressure sensor is the piezoresistive sensor that uses piezoresistors to detect pressure changes.
The piezoresistors are usually made of silicon strain gauges that change their electrical resistance when subjected to pressure.
As the temperature changes, the resistance of the piezoresistors also changes due to silicon’s temperature coefficient of resistance (TCR). The TCR of silicon is around 2,800-3,000 ppm/°C, meaning the resistance changes by 2,800-3,000 parts per million for every 1°C change in temperature.
This change in piezo resistor resistance due to temperature causes an offset error in the sensor’s output – it makes the sensor think there is a pressure change when there is none. This is the temperature drift of the sensor.
For example,
Let’s say a sensor has a sensitivity of 2 mV/V/bar. At 25°C, the sensor outputs 0 mV at 0 bar pressure.
Now if the temperature increases to 50°C, the piezoresistors’ resistances will change due to their TCR.
This resistance change may cause the sensor’s output to increase by 20 mV, making it look like there is 10 bar (20 mV / 2 mV/V/bar) of pressure even though there is no actual pressure change.
This is a 10 bar offset error due to temperature drift.
Ways to reduce this drift include temperature compensation circuits, thermal isolation of piezo resistors, using different materials for piezoresistors with lower TCR, and performing temperature calibration of the sensor.
With the proper compensation techniques, high-end pressure sensors can achieve very low-temperature drift of just ±0.05% of full scale output (FSO) over the operating temperature range.
But in many applications, a drift of ±0.1% to ±0.5% FSO is more typical.
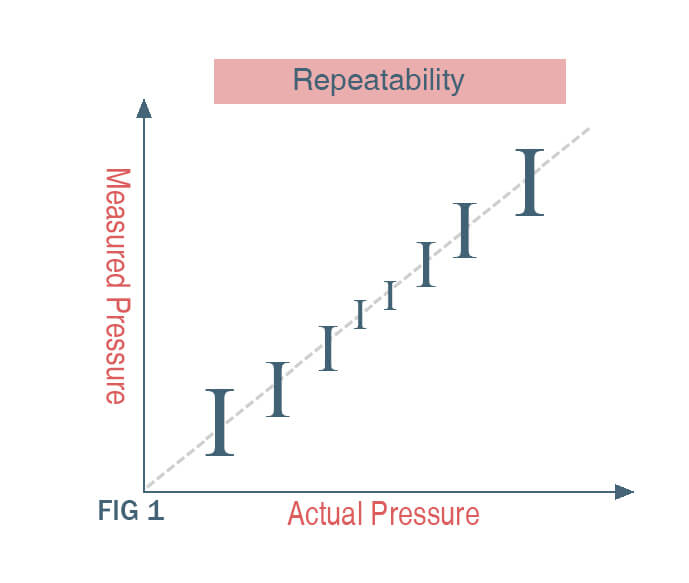
Temperature Drift and Repeatability: An Interconnected Relationship
Repeatability refers to the sensor’s ability to measure the same pressure value consistently when the same pressure is applied multiple times. Temperature drift can negatively impact repeatability in pressure sensors.
As explained in my previous answer, temperature changes cause the piezoresistors in piezoresistive pressure sensors to change resistance due to their temperature coefficient of resistance (TCR).
This resistance change manifests as an offset error in the sensor’s output, making it appear that there is a pressure change when there is none.
This offset error due to temperature drift will be different each time the sensor temperature changes, even if the actual pressure remains the same.
This means the sensor will report a different pressure value each time, reducing its repeatability.
The relationship between temperature drift and repeatability can be summarized as:
- Higher temperature drift leads to lower repeatability
- Lower temperature drift results in higher repeatability
To quantify this, we can define:
- Temperature drift = ∆P/∆T (Change in pressure reading per degree temperature change)
- Repeatability = ±∆P (Pressure reading variation at constant pressure)
We can see that temperature drift ∆P/∆T directly impacts the repeatability variation ∆P. The higher the temperature drift, the larger the pressure variation and the lower the repeatability.
Some technical specifications to look for regarding temperature drift and repeatability are:
- Total temperature drift: Specified as % of full-scale output (%FSO) over the operating temperature range
- Repeatability: Specified as %FSO at constant pressure and temperature
- Temperature coefficient of resistance (TCR) of piezoresistive material: Indicates how much resistance changes with temperature.
Temperature drift causes offset errors that vary each time the sensor heats up or cools down, limiting its ability to report the same pressure consistently and reducing repeatability.
Managing temperature drift through various techniques can therefore improve a pressure sensor’s repeatability.
Hysteresis and the Role of Temperature Drift
Temperature drift will cause a major impact on hysteresis, which is the difference in sensor output when the same pressure is applied vs released. An ideal sensor would have zero hysteresis, but in reality most sensors exhibit some hysteresis that increases with temperature drift.
You can find blow factors contribute to temperature drift and hence hysteresis in pressure sensors:
1, Piezoresistive sensors: These use resistive elements that change resistance with applied pressure. However, the resistance also changes with temperature. This temperature dependence results in the sensor output changing with temperature, independently of the pressure. The change can be +/-0.05% to 0.2% per degree Celsius.
Please remember: Higher temperature drift leads to higher hysteresis.
2, Membrane properties: The elastic properties of the diaphragm/membrane that the pressure acts on also vary slightly with temperature. This alters the sensor’s ability to accurately transduce pressure into an output signal at different temperatures.
3, Electronic components: Components like amplifiers and filters used in the sensor circuit exhibit characteristic changes with temperature that distort the sensor output.
To reduce temperature drift and hysteresis, you need to carefully consider below techniques:
1, Temperature compensation circuits: These circuits monitor the sensor’s temperature and electronically compensate for known temperature characteristics. This can cut drift by 50-80%.
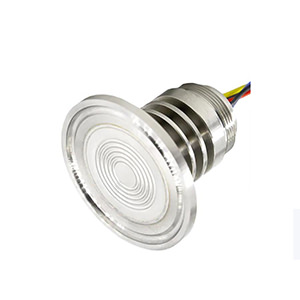
2, Thin film sensors: Instead of resistors, thin film semiconductor strain gauges that are less sensitive to temperature can be used.
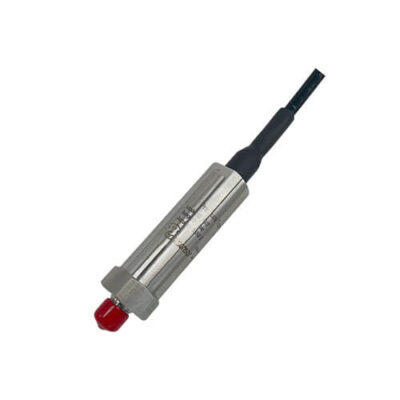
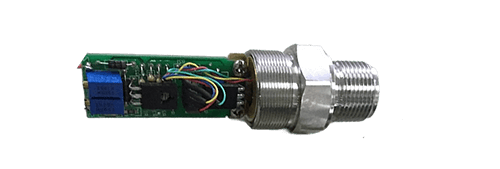
Here is an example pf Thin Film type pressure sensor produced by Eastsensor
3, Special materials: Membranes made of materials like silicon that have very low and stable property variation with temperature can be employed.
4, Calibration: Sensors are calibrated at multiple temperatures to generate correction curves that can then be applied to the outputs to cancel out temperature drift.
Design Considerations for Minimizing Temperature Drift Effects
Material selection is one of the most critical design factors impacting a pressure sensor’s temperature drift and hysteresis. The wrong choice of materials for the sensing element, membrane and packaging can lead to large temperature variations in the sensor’s output.
Below are some practices for your further reference
For piezoresistive sensors:
Piezoresistive sensors commonly use silicon as the sensing material due to its near-zero TCR of around -0.05%/°C. Other options with even lower TCR include Constantan alloys (-0.002%/°C) and tantalum nitride thin films (<0.005%/°C).
For the membrane/diaphragm:
Silicon is again the preferred choice due to its extremely low and stable TCE of around 2.6 parts per million per °C (ppm/°C) from -55°C to 150°C. Other options with comparable stability include stainless steel (9-13 ppm/°C) and glass-reinforced epoxy (24-60 ppm/°C).
For packaging materials:
Ceramics are commonly used for pressure sensor packages due to their stable mechanical and hermetic sealing properties over wide temperatures. Alumina ceramics have one of the lowest TCE values at around 6-7 ppm/°C.
Here is full article selection guide for pressure sensor material you may need.
Temperature Compensation: A Vital Technique for Combating Drift
Temperature compensation is a technique used to electronically correct for the effects of temperature variations on a pressure sensor’s performance. It helps stabilize the sensor’s output in the face of changing temperatures, resulting in:
- Improved accuracy – By cancelling out the sensor’s inherent temperature drift, the accuracy of measuring the actual pressure input is enhanced. This is because temperature fluctuations won’t cause as much error in the sensor output.
- Better repeatability – When the same pressure is applied multiple times at different temperatures, the sensor will give consistent readings due to the temperature compensation circuit eliminating much of the variable temperature effects.
- Lower hysteresis – Since temperature compensation works to negate the temperature dependence of the sensor’s output, the difference between increasing and decreasing pressure measurements (hysteresis) is reduced.
How temperature compensation do to stabilize accuracy, repeatability, and hysteresis
A temperature compensation circuit works by monitoring the sensor’s temperature using a thermistor or RTD (Resistance Temperature Detector). The circuit then applies compensation to the sensor output based on pre-measured data that corresponds temperature values with the known magnitude of output drift at those temperatures.
The compensation is realized either by:
- Applying an offset voltage to cancel out the effect of temperature
- Performing mathematical calculations on the sensor signals based on temperature-dependent correction curves derived from calibration data.
In both cases, the aim is to electronically nullify the sensor’s inherent sensitivity to temperature variations, thus stabilizing its output and improving key performance metrics like accuracy, repeatability and hysteresis.
You can also check below article for more details about temperature compensation
Calibration and Addressing Temperature Drift in Measurement Devices
Calibration is also the process of adjusting a measurement device so that it provides readings that accurately represent actual input values.
For pressure sensors producer, you can try below steps of calibration to addresses temperature drift:
- The sensor is placed in a temperature chamber or oven that can precisely control the temperature.
- The sensor is exposed to known input pressure values at different temperatures within its operating range. For example, at 0 degrees C, 25 degrees C and 50 degrees C.
- The sensor’s actual output readings are recorded at each temperature setting and input pressure.
- The recorded output values are then compared to the known input pressures. Any differences represent temperature-related drift or error in the sensor’s readings.
- Correction curves are generated that map the sensor’s output values to the actual input pressures at each temperature. These curves factor in the sensor’s inherent temperature drift.
- During use, the sensor’s temperature is monitored and based on the detected temperature, the corresponding correction curve is applied to the sensor’s raw output reading. This “corrected” output value is the sensor’s actual pressure reading that compensates for temperature drift.
- The calibration process and generation of correction curves is repeated periodically over the sensor’s lifetime to account for any changes in its temperature characteristics over time.
By recording the sensor’s output at different temperatures and pressures during calibration, you can determine the exact magnitude of temperature drift affecting the sensor’s readings.
The correction curves derived from this data then allow us to electronically compensate for temperature effects during normal operation, yielding accurate measurements that are independent of temperature variations.