Zero-point error is important for pressure sensors because it refers to the error or deviation from the true zero pressure reading. This error can occur due to various factors such as sensor drift, temperature changes, or manufacturing tolerances.
If the pressure sensor has a non-zero output when there is no applied pressure, it can lead to incorrect measurements and inaccurate data. This error can be especially critical in applications where precise pressure measurements are crucial, such as in industrial processes, medical devices, or aerospace systems.
What is the Zero-point Error of the pressure sensor?
The zero-point error of a pressure sensor refers to how accurately it measures zero pressure.
Ideally, at zero pressure, the sensor output should read exactly zero. However, in reality, most pressure sensors will output a slight measurement error even at no pressure applied.
This error can result from many factors, like residual stress in the sensor materials, hysteresis effects, nonlinearity in the sensor, and temperature changes. The zero-point error spec provides an indication of a sensor’s accuracy at measuring very low pressures near zero.
A lower zero-point error specification means the sensor reads closer to zero when no pressure is present, indicating better accuracy for measuring very small pressures. The error is often listed as ±% of the sensor’s full scale output (FSO).
For example:
Zero-point error: ±1% FSO
This means the sensor output could read anywhere from -1% to +1% of its maximum rated output at zero pressure. So if the FSO is 100 psi, the zero-point error would be ±1 psi.
A pressure sensor with a lower error specification, like ±0.25% FSO will be more accurate at measuring pressures very close to zero, whereas a sensor with ±2% FSO error will exhibit a larger measurement error near zero pressure.
What is the difference between zero-point error and span error?
Zero-point and span errors are key specifications that indicate a pressure sensor’s accuracy. They refer to:
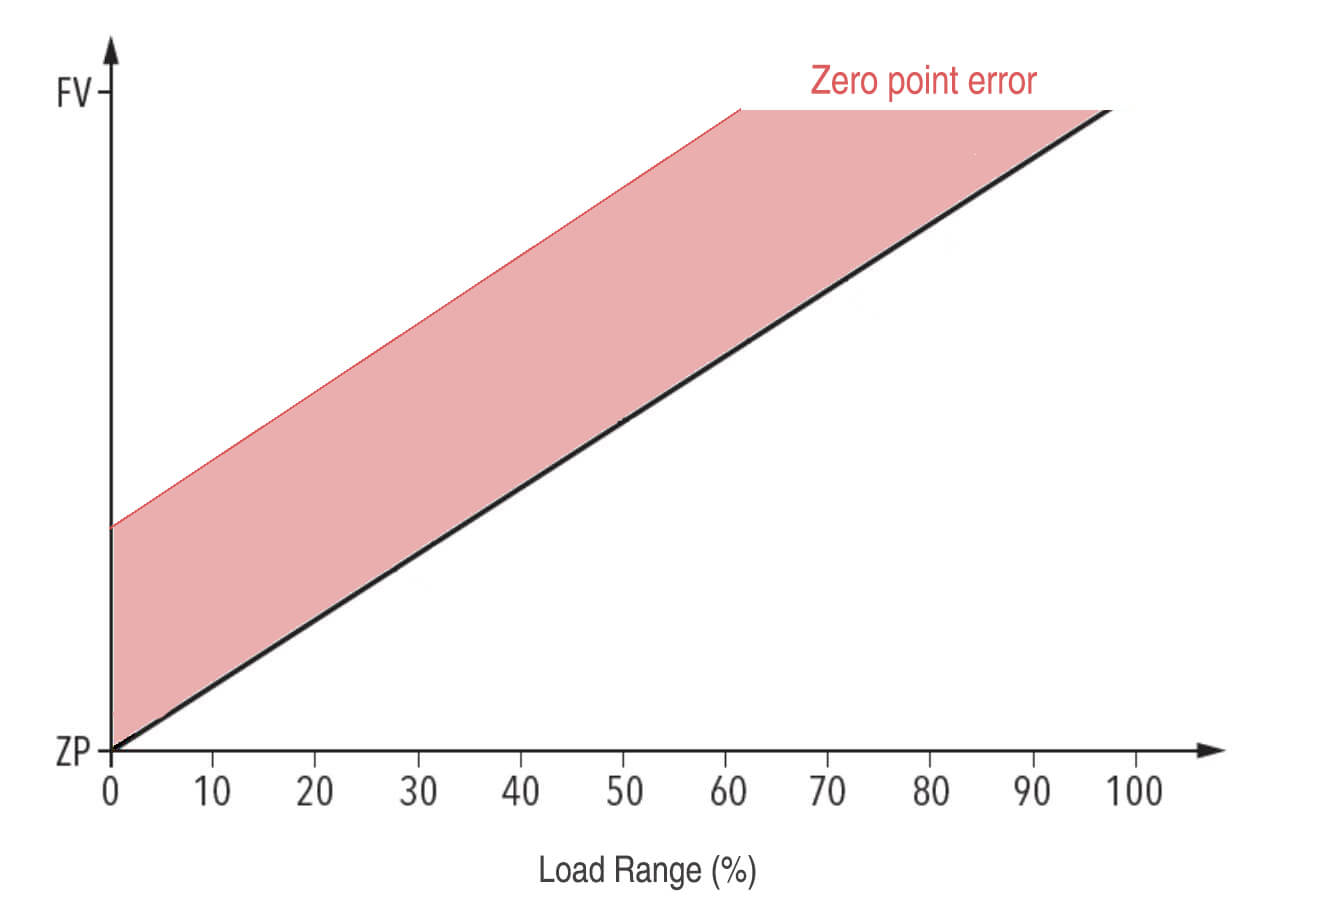
Zero-point error: The error in the sensor’s output when no pressure is applied. Measures the sensor’s accuracy at or near zero pressure.
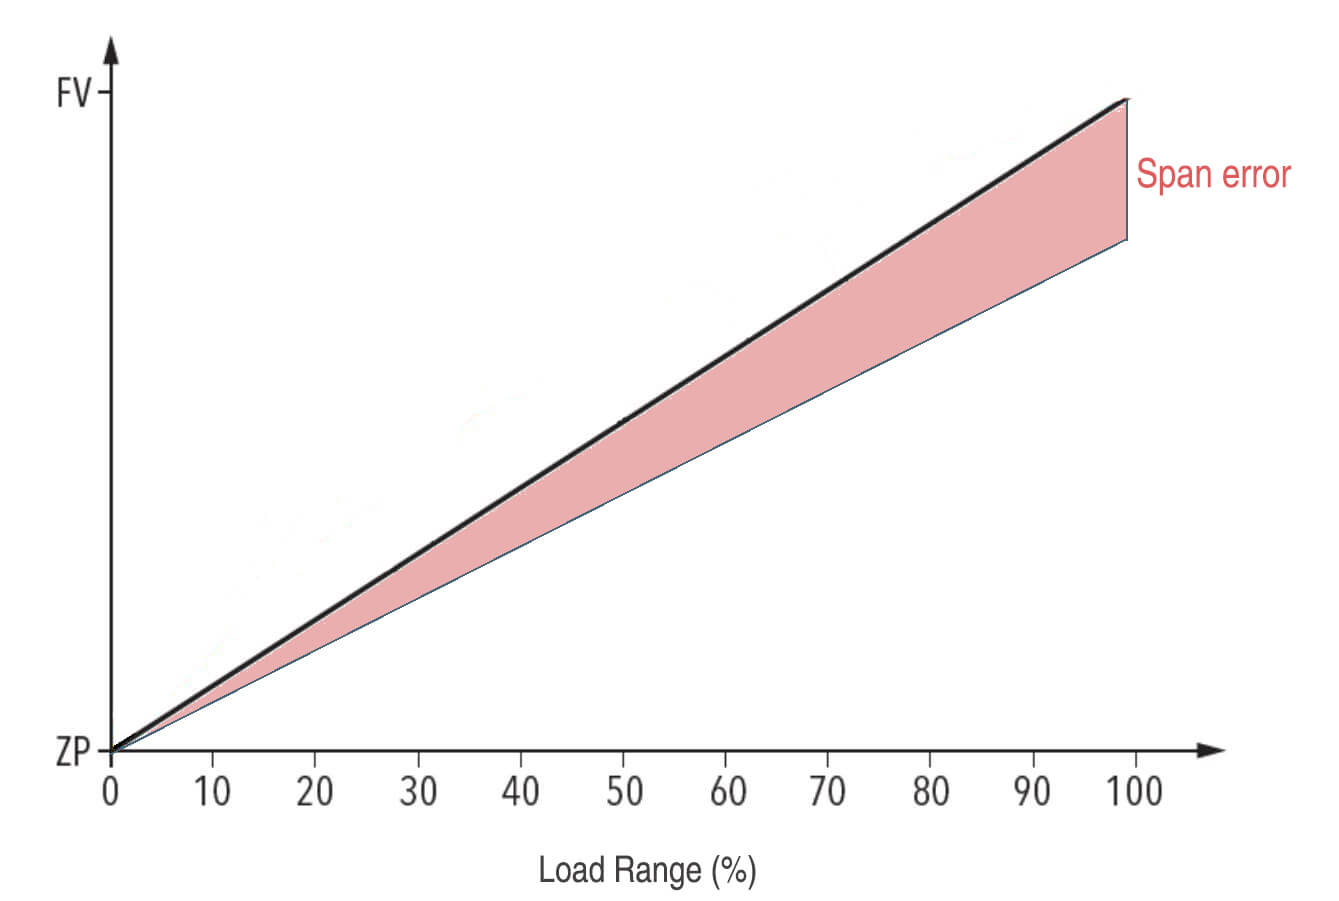
Span error: The error in the sensor’s output at its full scale pressure rating. Measures the sensor’s accuracy at its maximum measurable pressure.
Both errors reflect the deviation from the sensor’s ideal I-P (input-output) transfer curve, and both errors are adjustable.
An ideal sensor’s zero-point error would be 0%, indicating the output is exactly 0 at zero pressure. And the span error would also be 0%, meaning the output matches the full-scale pressure rating exactly.
However, in real sensors, there are always some errors. The zero-point and span errors indicate:
- How linear the sensor’s response is across its pressure range
- How much the sensor’s output deviates from the ideal transfer curve
- The overall accuracy of the sensor
So a pressure sensor with lower zero-point and span error specifications, like ±0.1% for both, will provide more accurate and linear measurements compared to a sensor with ±1% errors.
The errors tend to behave differently based on the sensor design and manufacturing variation. So, specifying both the zero-point and span errors gives a more complete picture of a sensor’s performance and accuracy.

How it affect pressure sensor accuracy
For example, let’s consider two pressure sensors with these specifications:
- Sensor A:
- Zero-point error: ±1% full scale
- Range: 0 to 100 psi
- Sensor B:
- Zero-point error: ±0.1% full scale
- Range: 0 to 100 psi
Both sensors measure pressures from 0 to 100 psi. But Sensor B has a lower zero-point error of ±0.1%, while Sensor A’s is ±1%.
This means:
- At zero pressure (0 psi), Sensor A’s reading could be off by up to ±1 psi (1% of 100 psi). So its measured value could range from -1 psi to +1 psi.
- In contrast, at 0 psi, Sensor B’s reading would only be off by ±0.1 psi (0.1% of 100 psi). Its measured value would be closer to the actual 0 psi value.
So for measuring very small pressure changes near zero psi, Sensor B with the lower error will provide more accurate readings. It can detect smaller variations in pressure.
How to reduce this error?
Improve design and materials
Using stiffer materials, more symmetrical sensor designs, and optimized dimensions can minimize residual stress and hysteresis effects that cause such error.
Using stiffer materials that are less prone to residual stress, hysteresis and drift, along with symmetrical sensor designs that distribute stresses and deflect more uniformly, can all reduce the various sources of the errors in pressure sensors. This, in turn, enables the manufacture of sensors with lower zero-point error specifications and higher accuracy near zero pressure.
However, it requires engineering and materials expertise.
Increase the precision of manufacturing
Tighter tolerances, more precise machining, and higher-accuracy assembly can reduce manufacturing variations that introduce zero-point error.
Improved dimensional tolerances can ensure that the sensor’s structures and components are manufactured within tighter acceptable limits. This means less variability in key parameters like thickness, length, spacing, alignment, etc.
Variations in dimensions beyond the tolerances can introduce uncertainties that contribute to zero-point error. So tighter tolerances translate to less dimensional variations and therefore lower zero-point error.
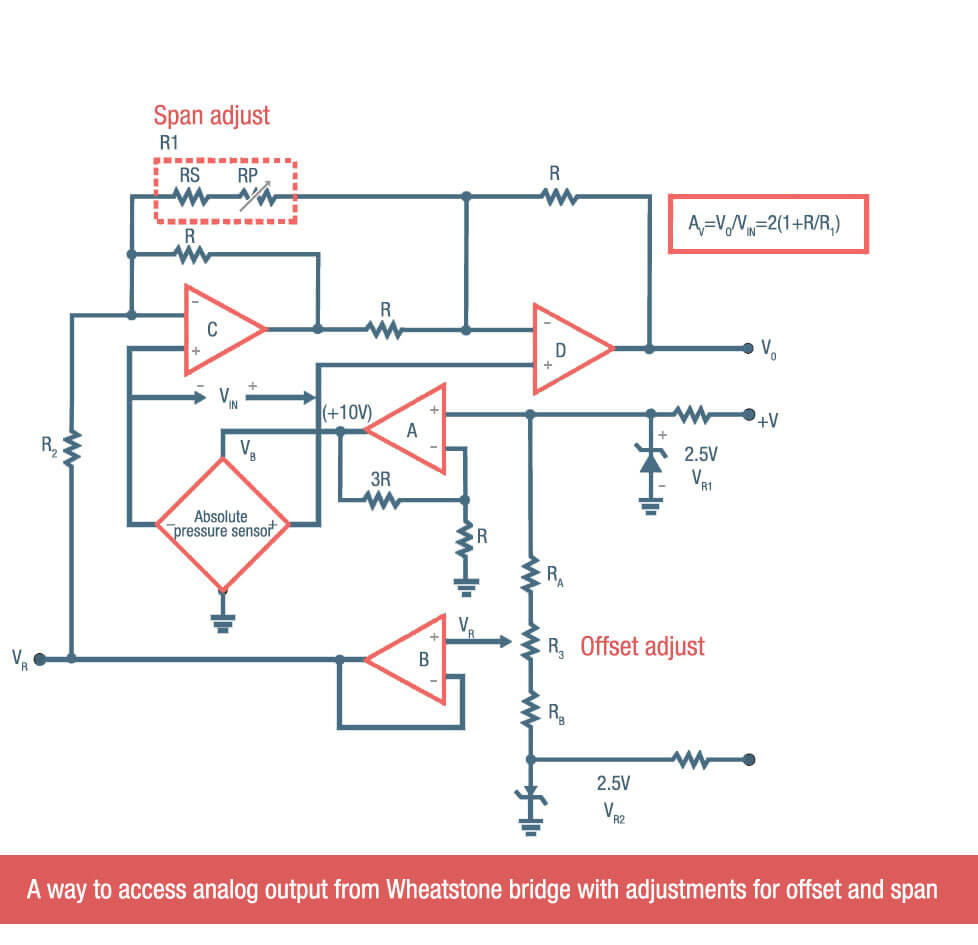
Perform offset trimming
Mechanically or electrically adjusting the sensor’s output offset to minimize error at zero pressure. This is done during sensor calibration and testing. The offset is “trimmed” until the output at zero pressure is as close to the ideal value as possible.
Here are the steps:
- Place the sensor at zero pressure – This ensures no actual pressure is applied to the sensor that would cause a non-zero output.
- Measure the sensor’s initial output – This gives you a baseline reading of the sensor’s offset output at zero pressure, before any adjustments are made.
- Make an initial mechanical or electrical adjustment – This depends on the sensor type:
- For diaphragm sensors, bend the diaphragm slightly to shift the output closer to zero.
- For strain gauge sensors, adjust a potentiometer or trim resistor to alter the output voltage or current.
- For silicon pressure sensors, tune a reference voltage to change the offset.
- Measure the sensor’s new output at zero pressure.
- Compare the new output to the ideal zero value (e.g. 0 V, 4mA).
- If needed, make further small adjustments in the same direction as before. Then remeasure the output
- Repeat steps 5 through 7 until the sensor’s output at zero pressure matches the ideal value within the specified tolerances.
- Record the final offset adjustment made and the resulting zero-point error for calibration data.
Perform digital compensation
Using a microcontroller or compensation circuit to mathematically calculate and remove sources of zero-point error based on sensor data and models of error sources. This is an example of “self-compensation”.
By characterizing sources of zero-point error like offset, temperature sensitivity, and nonlinearity – and then applying compensation algorithms to mathematically remove these errors from the sensor output in real-time – the microcontroller is able to reduce the overall zero-point error of the sensor and improve its performance.
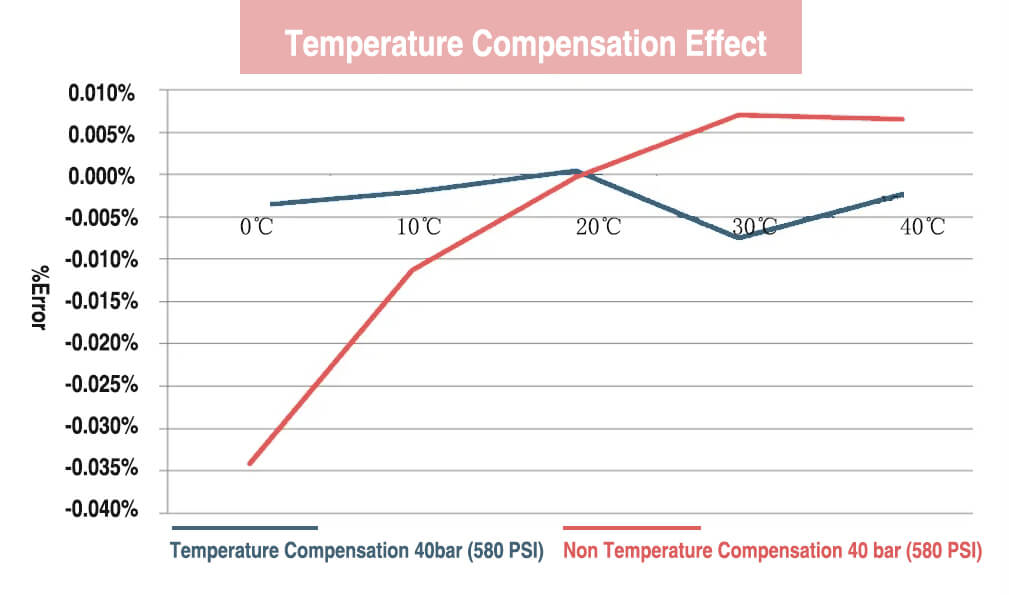
Use temperature compensation
Characterizing and compensating for the sensor’s change in zero-point error with temperature can also reduce errors from this source.
Temperature fluctuations cause the sensor’s physical dimensions and internal stresses to change. So temperature changes can significantly affect the zero-point error of a pressure sensor, this introduces apparent pressure that shows up as zero-point error.
For example, as temperature increases, sensor materials may expand introducing additional stresses that contribute to an offset output even at zero pressure. Therefore, characterizing how the sensor’s zero-point error changes with temperature is critical.
During testing, the sensor’s zero-point error is measured at different temperatures:
- – At 20°C, the zero-point error may be ±0.2% full scale
- – At 50°C, it may increase to ±0.4% full scale
- – At -10°C it may decrease to ±0.1% full scale
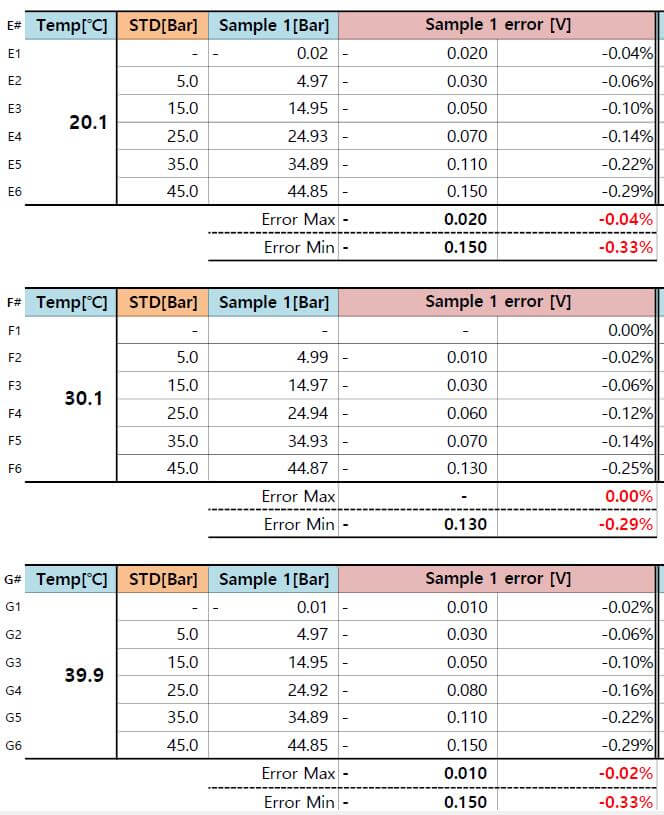
img: Testing data of ESS501V at 20.1°C, 30.1°C and 39.9°C
From this data, a temperature compensation model is developed to describe the sensor’s change in zero-point error over its full temperature range.
Then during operation, the sensor’s temperature is continuously monitored. The temperature compensation model is used to calculate what the sensor’s zero-point error should be at that temperature. So a corresponding adjustment is applied to the sensor output to compensate for and effectively “remove” that temperature-induced zero-point error.
The result is that the zero-point error is significantly reduced over the sensor’s full operating temperature range compared to without compensation.
Take an example to clarify zero-point error

Here is an example to clarify zero-point error:
Let’s assume that you have a pressure sensor with the following specifications:
- Range: 0 to 100 psi
- Full scale output: 5 V
- Linearity: ±1% full scale
- Zero-point error: ±2% full scale
This means:
- The sensor’s output should increase linearly from 0 V at 0 psi up to 5 V at 100 psi.
- The output will be within ±1% of the ideal linear output over the full pressure range.
- At 0 psi, the output could read anywhere from -2% to +2% of full scale, which is -100 mV to +100 mV.
So at zero pressure, the sensor’s actual output could range from -0.1 V to +0.1 V.
This ±0.1 V variation is the sensor’s zero-point error, indicating a lack of accuracy near zero pressure.
Now consider another sensor with:
- Zero-point error: ±0.5% full scale
This means:
- At 0 psi, the output will only vary between -0.5% to +0.5% of full scale, which is -25 mV to +25 mV.
- So the sensor’s actual zero pressure output will range from -0.025 V to +0.025 V.
This ±0.025 V variation is a significantly lower zero-point error, indicating higher measurement accuracy for very low pressures close to zero.
Obviously, a lower zero-point error specification like ±0.5% full scale instead of ±2% will
- Allows the sensor output to vary less at zero pressure
- Results in measurements that are closer to the ideal (error-free) output at 0 psi
- Indicates better resolution and accuracy for detecting very small pressure changes near zero pressure