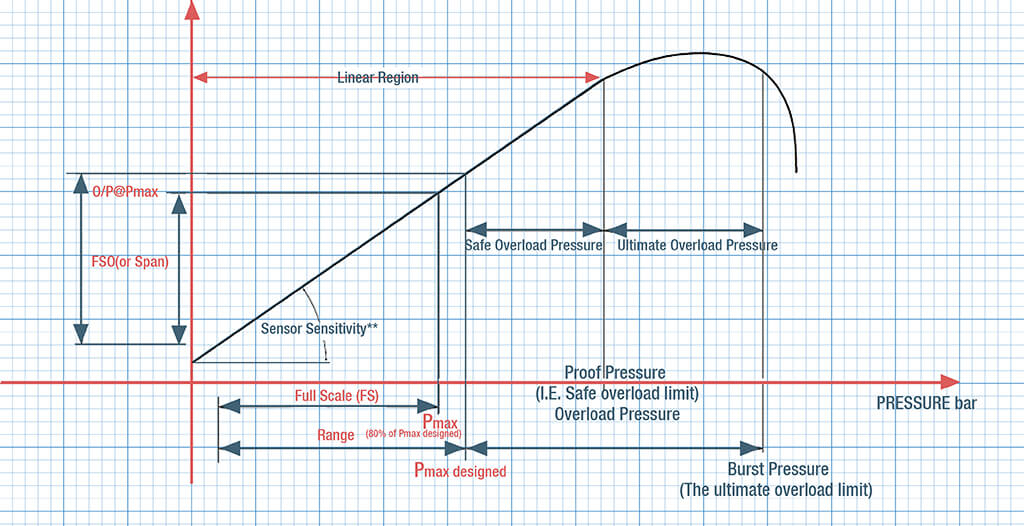
What is Overload Pressure
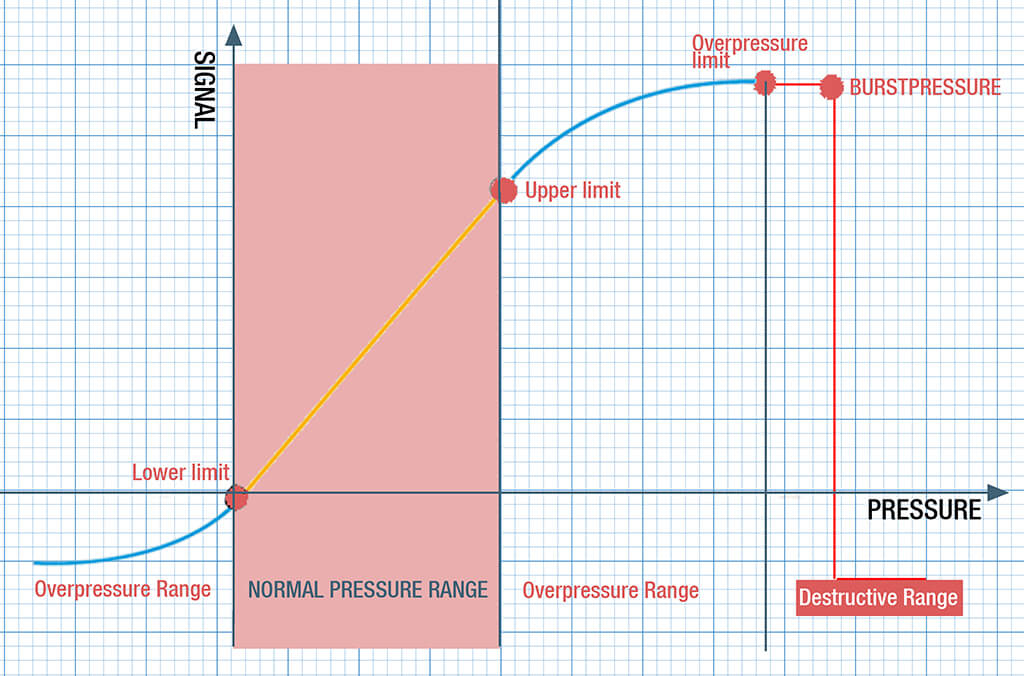
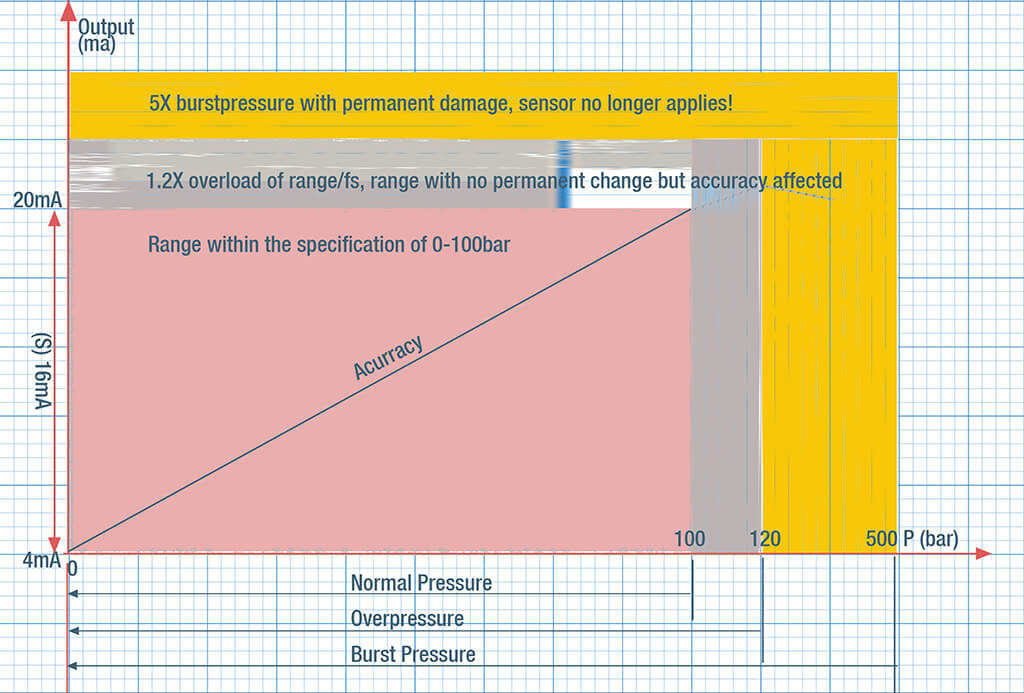
Overload pressure (also called overpressure) refers to a situation where the pressure applied to a sensor exceeds its specified maximum operating range.
Overload pressure can significantly impact the accuracy and reliability of pressure sensors by causing mechanical deformation, calibration shifts, hysteresis, material fatigue, and compromised signal integrity. Understanding these effects and implementing preventive measures is crucial for maintaining the performance and longevity of pressure sensors in various applications.
Effects of Overload Pressure on Accuracy
Mechanical Deformation and Damage
Overloading can cause permanent deformation of the sensor’s diaphragm or other mechanical components.
For piezoresistive and capacitive sensors, this deformation changes the mechanical properties, leading to shifts in the baseline output and reduced accuracy.
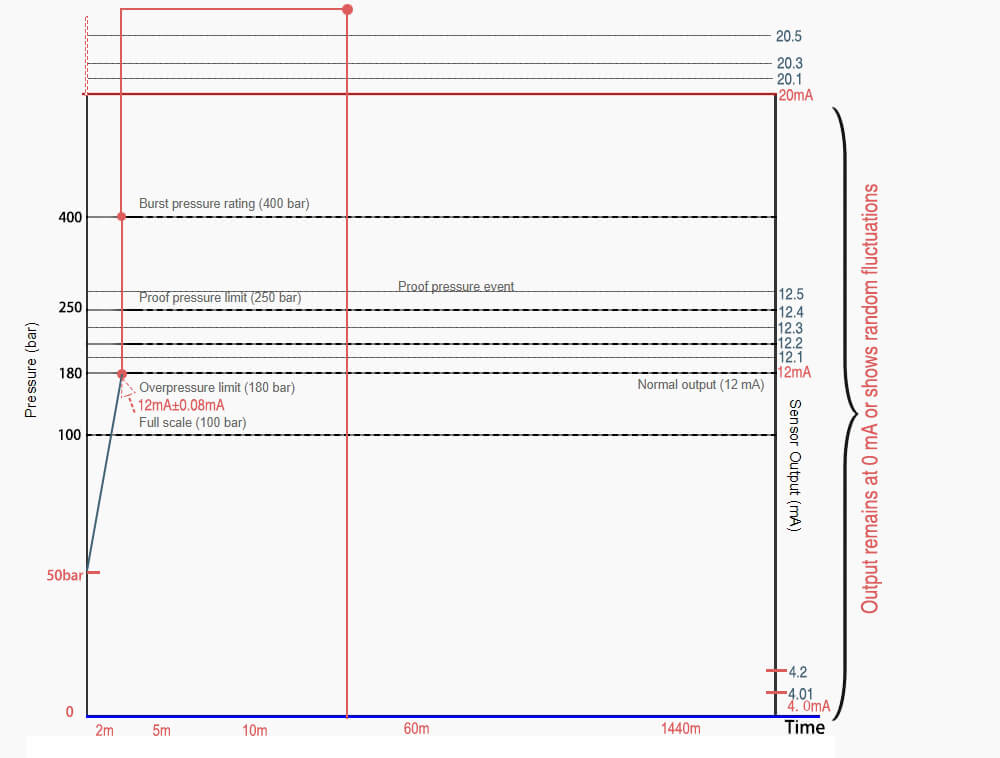
In extreme cases, the diaphragm or sensing element may fracture or rupture, rendering the sensor unusable. This is particularly critical for piezoelectric sensors that rely on the crystalline structure to generate a charge.
Calibration Shift
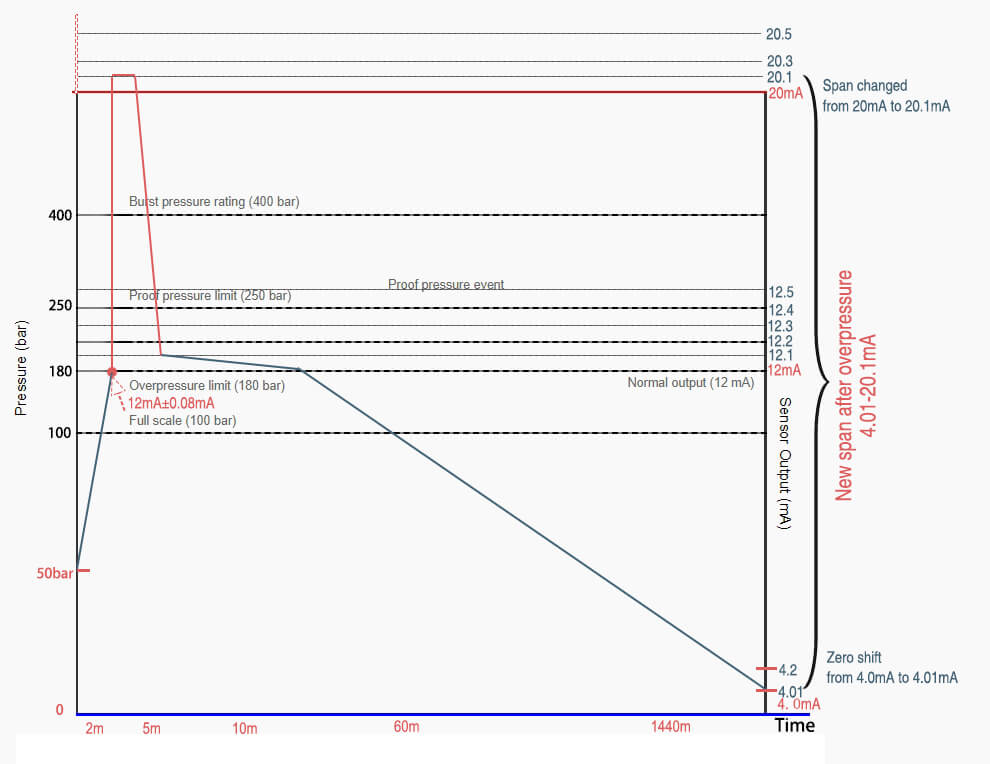
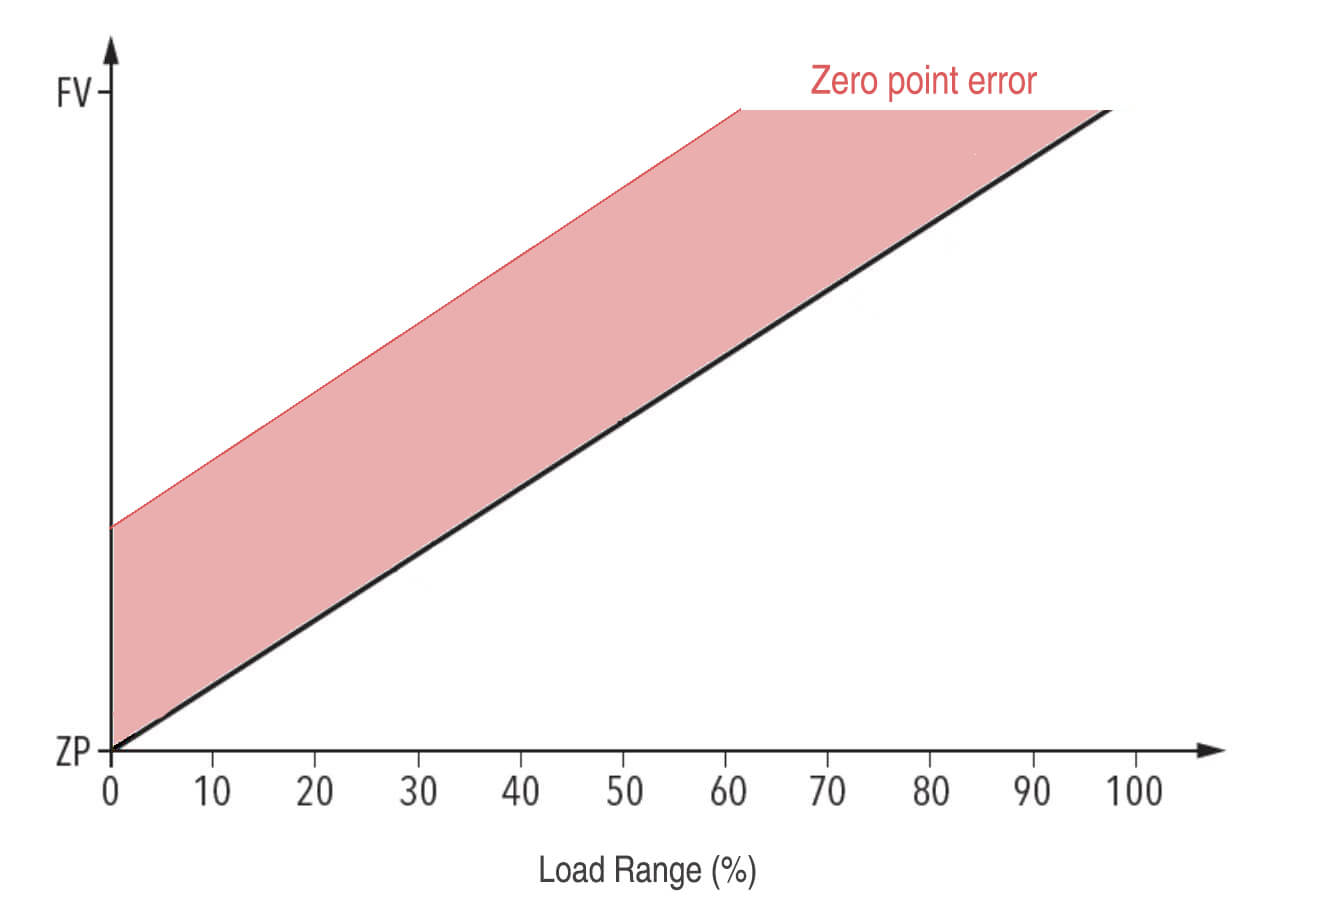
In another hand, overload especially more than durable overload can cause a permanent shift in the zero point of the sensor, meaning it will no longer read zero pressure accurately when no pressure is applied.
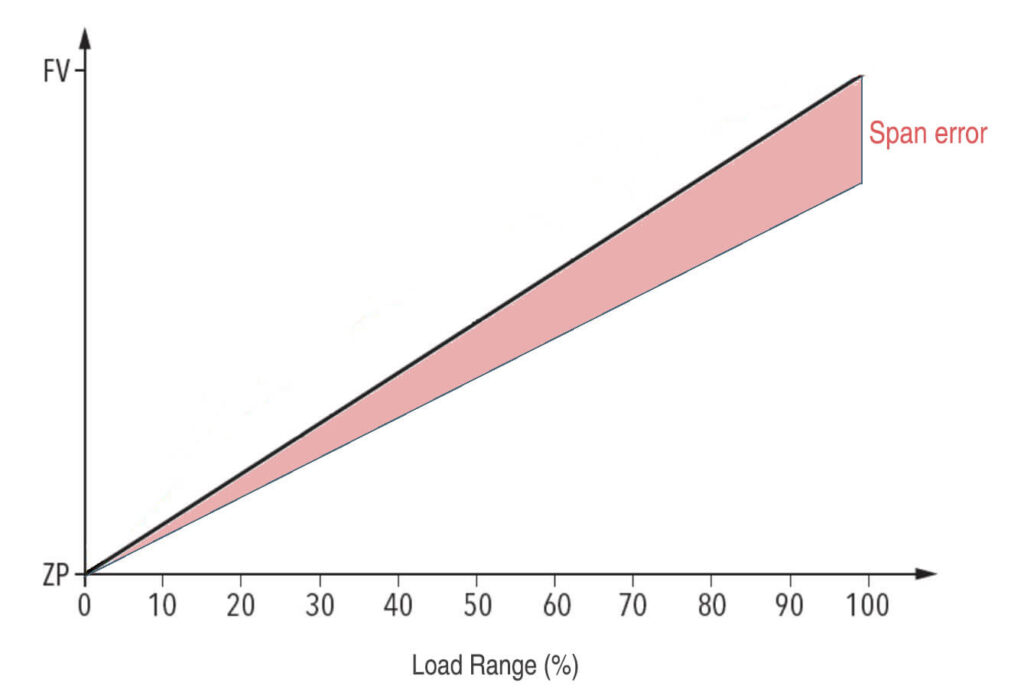
The sensitivity or span of the sensor (the relationship between input pressure and output signal) can also be altered. This means that for a given pressure range, the sensor may output incorrect values, deviating from its calibrated slope.
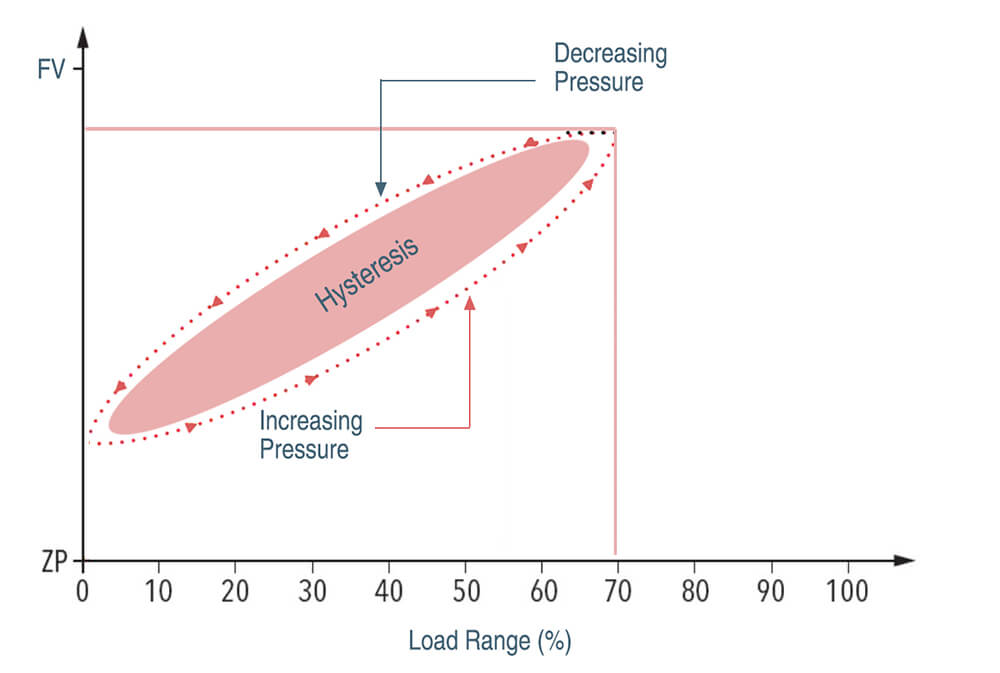
Hysteresis
After experiencing overload, the sensor might exhibit hysteresis, where its output for increasing and decreasing pressures does not follow the same path. This non-linear response can lead to inaccuracies, especially in dynamic applications where pressure fluctuates.
Electrical and Material Fatigue
Overloading can lead to micro-cracks in the piezoelectric material, causing a reduction in its ability to generate charge under stress. This results in lower sensitivity and accuracy.
Repeated overloading can cause fatigue in the strain gauges, leading to changes in their resistance characteristics and thus affecting the sensor’s output.
Compromised Signal Integrity
Overloading can induce electrical noise or signal interference, particularly in sensors with integrated electronics. This can degrade the signal-to-noise ratio, making it difficult to obtain precise readings.
Take an example
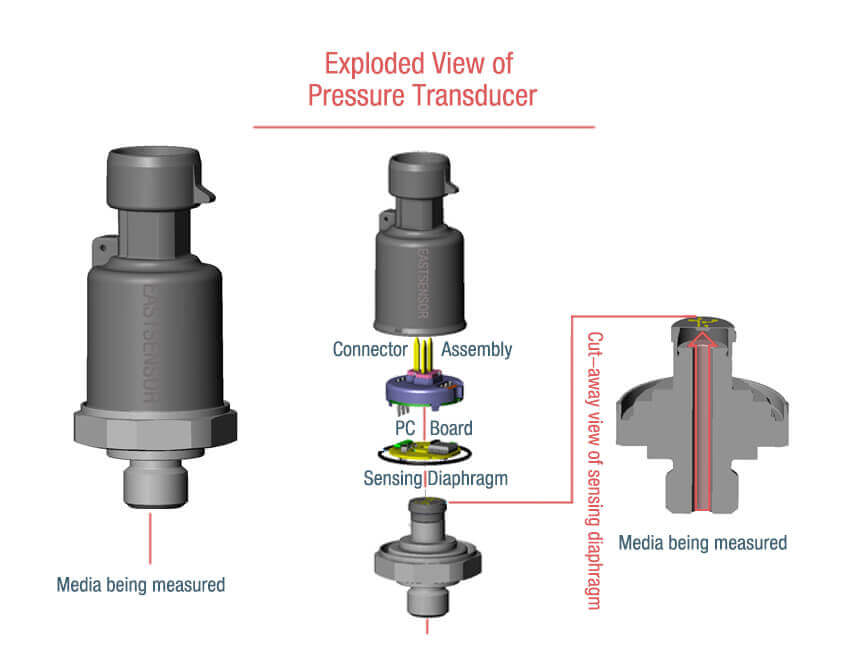
Let’s take an example to illustrate how overpressure can affect pressure sensor accuracy. We’ll consider a hypothetical piezoresistive pressure sensor designed for measuring pressures in the range of 0-100 psi.
Background
Sensor Specifications:
– Measurement Range: 0-100 psi
– Rated Overpressure: 150 psi
– Accuracy: ±0.5% Full Scale (FS)
– Output: 0-5V linear
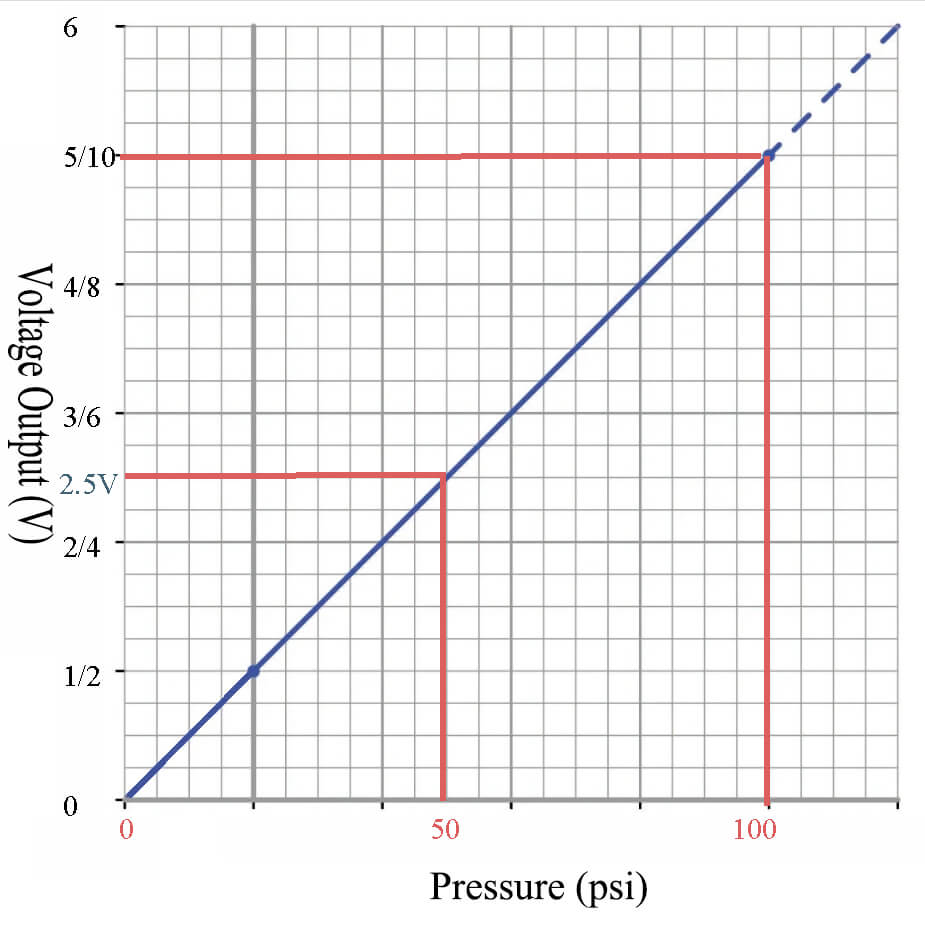
Initial Calibration:
- 0 psi = 0.00V
- 50 psi = 2.50V
- 100 psi = 5.00V
Steps
Step 1: Normal Operation
Under normal operating conditions (0-100 psi), the sensor performs within its specified accuracy of ±0.5% FS, which is ±0.5 psi.
Step 2: Overpressure Event
Let’s say the sensor is accidentally exposed to 140 psi (below the rated overpressure but above the measurement range).
Step 3: Post-Overpressure Performance
After the overpressure event, we retest the sensor:
- 0 psi = 0.05V (instead of 0.00V)
- 50 psi = 2.52V (instead of 2.50V)
- 100 psi = 5.03V (instead of 5.00V)
Step 4: Analyze the Impact
- Zero OffsetShift:
The zero point has shifted by 0.05V, which translates to 1 psi (0.05V / 0.05V/psi).
- Span Change:
The span has increased slightly from 5.00V to 4.98V (5.03V – 0.05V).
- LinearityChange:
The midpoint (50 psi) reading is now slightly off the ideal linear response.
- Overall Accuracy:
– At 0 psi: Error is 1 psi (1% FS)
– At 50 psi: Error is 0.4 psi (0.4% FS)
– At 100 psi: Error is 0.6 psi (0.6% FS)
The sensor’s accuracy has degraded from the original ±0.5% FS to about ±1% FS due to the overpressure event.
This example demonstrates how an overpressure event, even within the sensor’s rated capabilities, can significantly affect accuracy through zero offset shifts, span changes, and linearity alterations. It underscores the importance of protecting sensors from overpressure conditions and regular calibration in demanding applications.
Duration Time| Repeat Times | Working Temperature
Overload Duration Time
As mentioned above, when a pressure sensor is subjected to pressures beyond its specified range (overload), its accuracy can be compromised, now let’s talk about the duration time.
Prolonged exposure to overload conditions can cause physical deformation or damage to the sensor element, leading to permanent shifts in calibration and reduced accuracy.
Some pressure sensors are designed to withstand temporary overloads, but the duration and magnitude of overload should be within the sensor’s specifications to prevent damage.
In another words, the longer a sensor is exposed to overload conditions, the greater the risk of mechanical failure or drift in the sensor’s output. This is because excessive force can alter the mechanical structure of the sensor, causing wear or damage that affects its long-term stability and accuracy.
Pressure sensors are typically designed with a safety margin, allowing them to withstand short-term overloads without damage. However, if overloads are frequent or sustained, it may be necessary to select a sensor with a higher pressure rating or incorporate protective mechanisms and choose the most durable cell material.
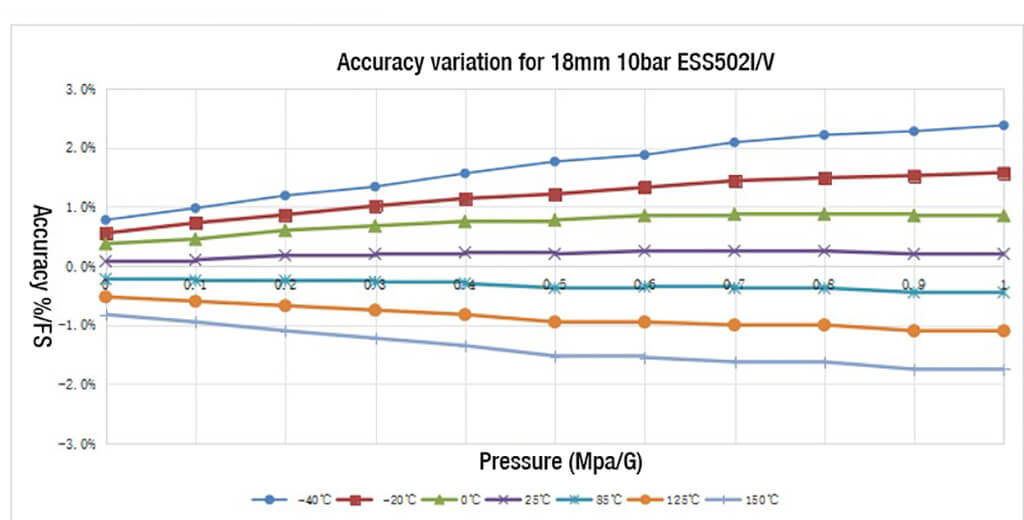
Working Temperature
Most pressure sensors have a specified temperature range in which they operate optimally. Deviations from this range can lead to errors due to changes in material properties or signal conditioning circuits.
High temperatures can cause drift in the output signal, while low temperatures might affect the sensor’s mechanical components or introduce additional noise.
Temperature changes can affect both the sensor’s materials and its electronic components. Thermal expansion can lead to mechanical stress, while temperature-sensitive electronic components can experience changes in resistance or capacitance, affecting the output signal.
In fact, many pressure sensors include temperature compensation features to minimize the impact of temperature variations on accuracy.
This can involve using materials with low thermal expansion coefficients or incorporating electronics that adjust the output based on temperature readings.
However, don’t forget the duration & repeat time!
The duration of over-temperature exposure can also significantly affect a pressure sensor’s performance and reliability, similar to how overload conditions impact the sensor.
Prolonged exposure to temperatures beyond the specified operating range can lead to material degradation. This includes changes in the sensor’s structural materials, like polymers or elastomers, which can become brittle or lose elasticity.
Metal components might also experience changes in mechanical properties, leading to compromised sensor integrity.
Repeated or sustained exposure to high temperatures can induce thermal stress. This stress can cause mechanical deformation or fatigue in the sensor’s elements, leading to permanent calibration shifts or even mechanical failure. The effects are more pronounced if the sensor undergoes rapid temperature cycling.
Take an example
Let’s explore how overpressure duration and repetition can affect sensor accuracy using a hypothetical example. We’ll consider a piezoresistive pressure sensor with the following specifications:
Background
Sensor Specifications:
- Measurement Range: 0-100 psi
- Rated Overpressure: 150 psi
- Initial Accuracy: ±0.25% Full Scale (FS)
- Output: 4-20 mA
Initial Calibration:
- 0 psi = 4.00 mA
- 50 psi = 12.00 mA
- 100 psi = 20.00 mA
Let’s examine three scenarios with varying overpressure durations and repetitions:
Scenarios
Scenario 1: Short Duration, Single Occurrence Overpressure: 140 psi for 1 second, once
Results after overpressure:
- 0 psi = 4.02 mA
- 50 psi = 12.01 mA
- 100 psi = 20.03 mA
Accuracy impact:
- Zero shift: 0.125% FS
- Span error: 0.0625% FS
- Overall accuracy: ±0.3% FS
Scenario 2: Extended Duration, Single Occurrence: Overpressure: 140 psi for 1 hour, once
Results after overpressure:
- 0 psi = 4.08 mA
- 50 psi = 12.05 mA
- 100 psi = 20.10 mA
Accuracy impact:
- Zero shift: 0.5% FS
- Span error: 0.125% FS
- Overall accuracy: ±0.55% FS
Scenario 3: Short Duration, Multiple Occurrences. Overpressure: 140 psi for 1 second, repeated 100 times over a week
Results after overpressure:
- 0 psi = 4.15 mA
- 50 psi = 12.10 mA
- 100 psi = 20.18 mA
Accuracy impact:
- Zero shift: 0.9375% FS
- Span error: 0.1875% FS
- Linearity error: 0.0625% FS
- Overall accuracy: ±1% FS
Analysis
Duration Effect:
- Short duration (Scenario 1) caused minimal accuracy degradation.
- Extended duration (Scenario 2) led to more significant zero shift and span error.
Repetition Effect:
- Multiple exposures (Scenario 3) resulted in cumulative damage, causing the most severe accuracy degradation.
- Repeated stress likely caused material fatigue in the sensing element.
Zero Shift:
- Increased with both duration and repetition.
- Most pronounced in Scenario 3, indicating potential permanent deformation.
Span Error:
- Generally less affected than zero shift.
- Increased with duration and repetition, but not as drastically as zero shift.
Linearity:
- Minimal impact in short-duration scenarios.
- Became noticeable with repeated exposures (Scenario 3).
Overall Accuracy:
- Degraded from initial ±0.25% FS to:
- Scenario 1: ±0.3% FS
- Scenario 2: ±0.55% FS
- Scenario 3: ±1% FS
How to go back to the original level after overload?
The ability of a pressure sensor to return to its original accuracy level after experiencing an overload depends on several factors, including the design of the sensor, the magnitude and duration of the overload, and whether the sensor has experienced any permanent damage.
Some pressure sensors are specifically designed to handle overload conditions without permanent deformation.
For example, if the overload is brief and within the sensor’s designed safety margin, the sensor is more likely to recover its original accuracy. Manufacturers often specify a maximum overload pressure that the sensor can tolerate for short periods.
These sensors may use materials and structures that can withstand temporary overloads, allowing them to return to their original accuracy once normal conditions resume.
On the other side:
If the overload causes permanent deformation of the sensing element or other mechanical components, the sensor may not return to its original level of accuracy. This is common if the overload exceeds the yield strength of the materials used in the sensor.
Flush Diaphragm Cell VS Monolithic Cell
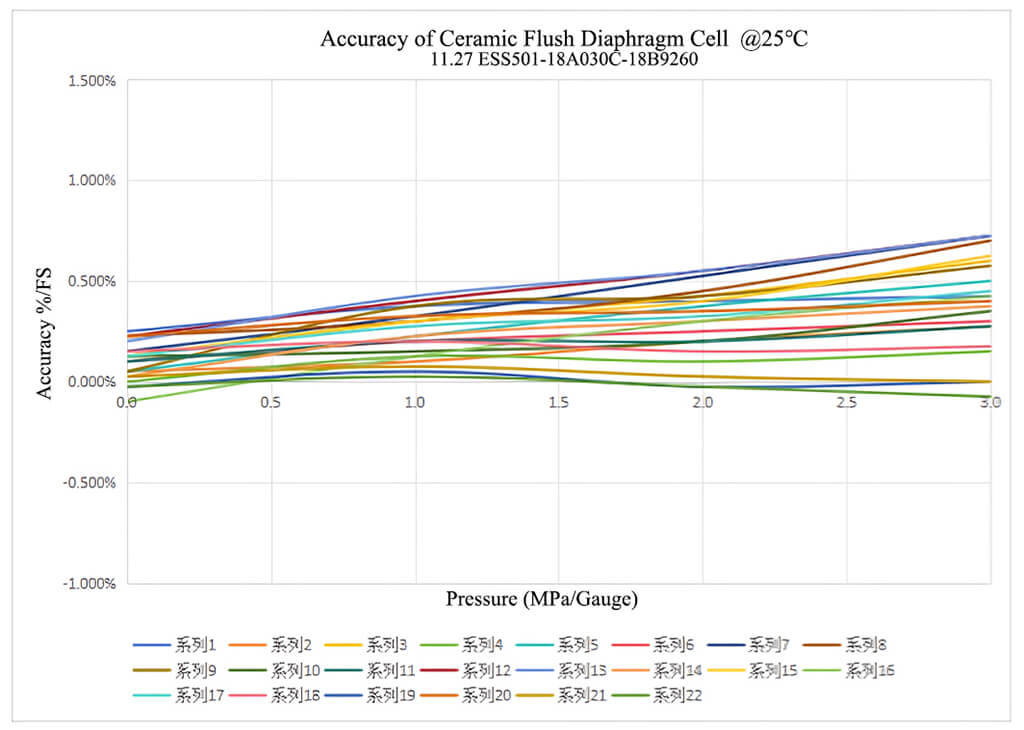
Ceramic piezo-resistive pressure sensors are known for their robustness and durability, particularly in harsh environments, when it comes to ceramic piezo-resistive pressure sensor cell and module, it is a fact that the flush diaphragm cell always has better overload performance and monolithic cell.
Overload Pressure Ability Comparison Between Monolithic & Flush Diaphragm Ceramic Cell
| Pressure Range (bar) | Overload Pressure (bar) | Burst Pressure (bar) |
| Monolithic Ceramic Cell | Flush Diaphragm Ceramic Cell | Monolithic Ceramic Cell | Flush Diaphragm Ceramic Cell |
| 1 | 0-5 | 10 | 20 | 15 | 40 |
| 2 | 0-10 | 20 | 30 | 30 | 50 |
| 3 | 0-16 | 32 | 48 | 48 | 80 |
| 4 | 0-20 | 40 | 60 | 60 | 100 |
| 6 | 0-25 | 50 | 75 | 75 | 125 |
| 7 | 0-35 | 60 | 100 | 90 | 150 |
| 8 | 0-50 | 75 | 150 | 125 | 250 |
| 9 | 0-70 | 105 | 200 | 175 | 300 |
| 10 | 0-100 | 200 | 250 | 300 | 400 |
| 11 | 0-200 | 300 | 400 | 500 | 600 |
| Above data was calculated and statistic zed between ESS501 and ESS502, for study reference only. |
Why?
There are many factors can contribute to this however, here we only talk about the structure and how it leads to difference performance of overload.
Uniform Pressure Distribution
The flush diaphragm design features a flat, smooth surface that allows pressure to be evenly distributed across the entire diaphragm area. This uniform distribution minimizes stress concentrations, which are critical points where mechanical failure is more likely to occur under high pressure.
In monolithic designs, the structure often includes varying thicknesses or features such as cavities and ridges, which can lead to uneven stress distribution. These irregularities increase the likelihood of localized stress points, which can result in deformation or failure during overload conditions.
Surface Contour
The flat and continuous surface of a flush diaphragm reduces the potential for pressure to concentrate at specific points. This structural characteristic helps the diaphragm to flex uniformly under pressure, maintaining structural integrity even when pressure exceeds normal operating levels.
The varying surface profile of a monolithic sensor can create areas where pressure is not evenly distributed. Changes in contour can act as stress concentrators where the material is more likely to yield or crack under overload conditions.
Mechanical Flexibility
The structural simplicity and mechanical flexibility of the flush diaphragm allow it to accommodate pressure changes more effectively, reducing the risk of structural failure. The diaphragm can deform elastically under pressure and return to its original shape once the pressure is relieved.
On the other hand, the more complex structure of monolithic sensors can restrict their ability to flex uniformly, increasing the risk of permanent deformation during overload events.
Immediate Effects of Overload
Before Overload: The diaphragm inside the sensor flexes within its elastic limit, accurately converting pressure to an electrical signal.
- Pressure (psi): 0, 10, 20, 30, 40, 50
- Sensor Output (V): 0, 0.2, 0.4, 0.6, 0.8, 1.0
After Overload: The diaphragm is permanently deformed. Even when the pressure returns to 35 psi, the diaphragm no longer returns to its original shape.
- Pressure (psi): 0, 10, 20, 30, 40, 50
- Sensor Output (V): 0.1, 0.25, 0.45, 0.65, 0.85, 0.95
Zero Drift: Initially, the sensor reads 0 psi perfectly when no pressure is applied. After the overload, it might read 2 psi instead of 0 psi.
Span Shift: The sensor’s sensitivity changes. If it originally outputted 1 V at 50 psi, it might now output 0.9 V at the same pressure, indicating a span shift.
Accuracy Before Overload: ±0.5 psi
Accuracy After Overload: The zero drift and span shift mean that the sensor might now have an accuracy of ±2 psi or worse. This means a true pressure of 35 psi might be read as anywhere from 33 to 37 psi, a significant deviation for critical applications like tire pressure monitoring.
Preventive Measures and Design Considerations
Overload Protection Mechanisms
These are physical barriers within the sensor that prevent the diaphragm or other sensing elements from moving beyond a certain limit. This helps avoid permanent deformation.
Or one can use pressure relief valves which can be integrated into the system to release excess pressure before it reaches the sensor, thereby preventing overload.
Material Selection
Using materials with higher tensile strength for the diaphragm and other critical components can help withstand brief overloads without permanent deformation.
SS316: Offers excellent corrosion resistance, high mechanical strength, and good temperature stability, making it ideal for harsh, high-pressure environments.
SS304: Provides good corrosion resistance and mechanical strength at a more economical cost, suitable for general industrial applications.
Ceramics: Provide exceptional hardness and chemical resistance, ideal for high-temperature and highly corrosive environments but require careful handling to avoid brittle failure.
Redundant Sensing Elements
Incorporating redundant sensing elements that can take over if the primary sensor fails due to overload can maintain system reliability, some designs also include a secondary diaphragm that acts as a backup in case the primary one fails, ensuring continuous operation.
Electrical Protection
In practice, by using surge protection devices, it can shield the sensor’s electronics from high voltage spikes that might occur during an overload event.
On the other hand, by incorporating filtering capacitors, it can also help eliminate electrical noise and ensure signal integrity, even if the sensor experiences brief overloads.