What is pressure sensor precision
Pressure sensor precision refers to the degree of repeatability or consistency in a series of measurements. It measures the ability of a sensor to provide consistent results when the same quantity is measured repeatedly under the same conditions.
When evaluating precision of pressure sensor, it is essential to consider the specified accuracy and repeatability.
Accuracy refers to the deviation between the measured pressure and the true pressure value.
Repeatability refers to the sensor’s ability to provide consistent measurements for the same applied pressure under the same conditions. Both accuracy and repeatability contribute to the overall precision of a pressure sensor.
What is pressure sensor accuracy
Pressure sensor accuracy refers to the degree of conformity between the measured pressure value provided by a sensor and the true or reference pressure value.
When evaluating pressure sensor accuracy, it is essential to consider the specified uncertainty or error limits provided by the manufacturer. Uncertainty represents the range within which the true pressure value is expected to lie, considering all sources of error. It is typically expressed as a percentage of the full-scale pressure range. Lower uncertainty values indicate higher accuracy.
Click to check The Complete Guide of: Pressure Sensor Accuracy
Aspects Affecting the Precision of Pressure Sensors
One of the most relevant factors affecting pressure sensor precision is the sensor’s sensitivity. Sensitivity refers to the change in output signal per unit change in pressure input.
A highly sensitive pressure sensor will produce a larger output signal for a given change in pressure, resulting in better precision. Sensitivity is usually expressed in units of volts per unit of pressure (e.g., volts per Pascal or volts per bar).
Another crucial factor is the sensor’s resolution. Resolution refers to the smallest change in pressure that a sensor can detect and measure accurately. It is determined by the number of bits in the analog-to-digital converter (ADC) used in the sensor’s signal processing circuitry. A higher resolution allows for more precise measurements, as it can detect smaller pressure changes.
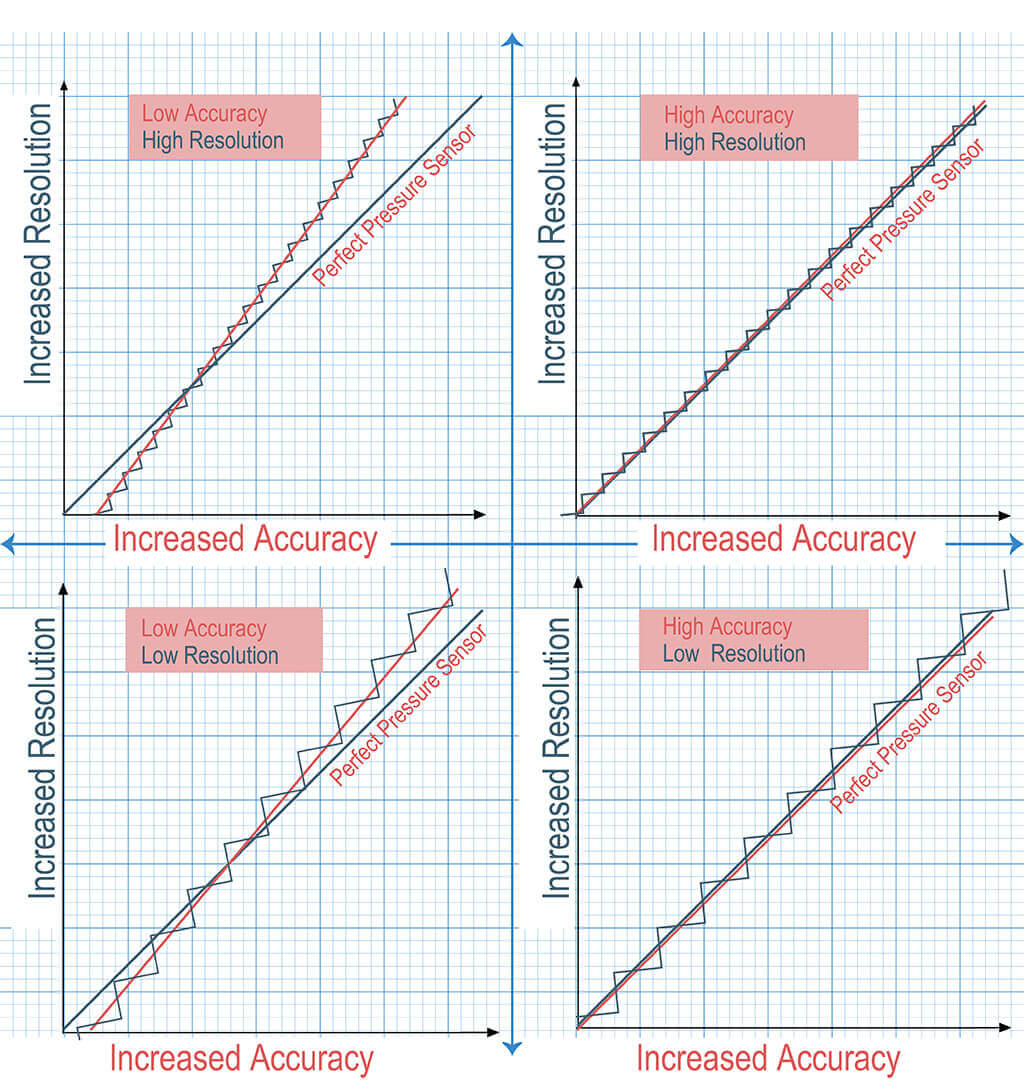
For example, a pressure sensor with a 16-bit ADC can resolve pressure changes as small as 0.001% of the full-scale range.
The linearity of a pressure sensor also plays a significant role in its precision. Linearity refers to how well the sensor’s output signal follows a straight line in relation to the applied pressure.
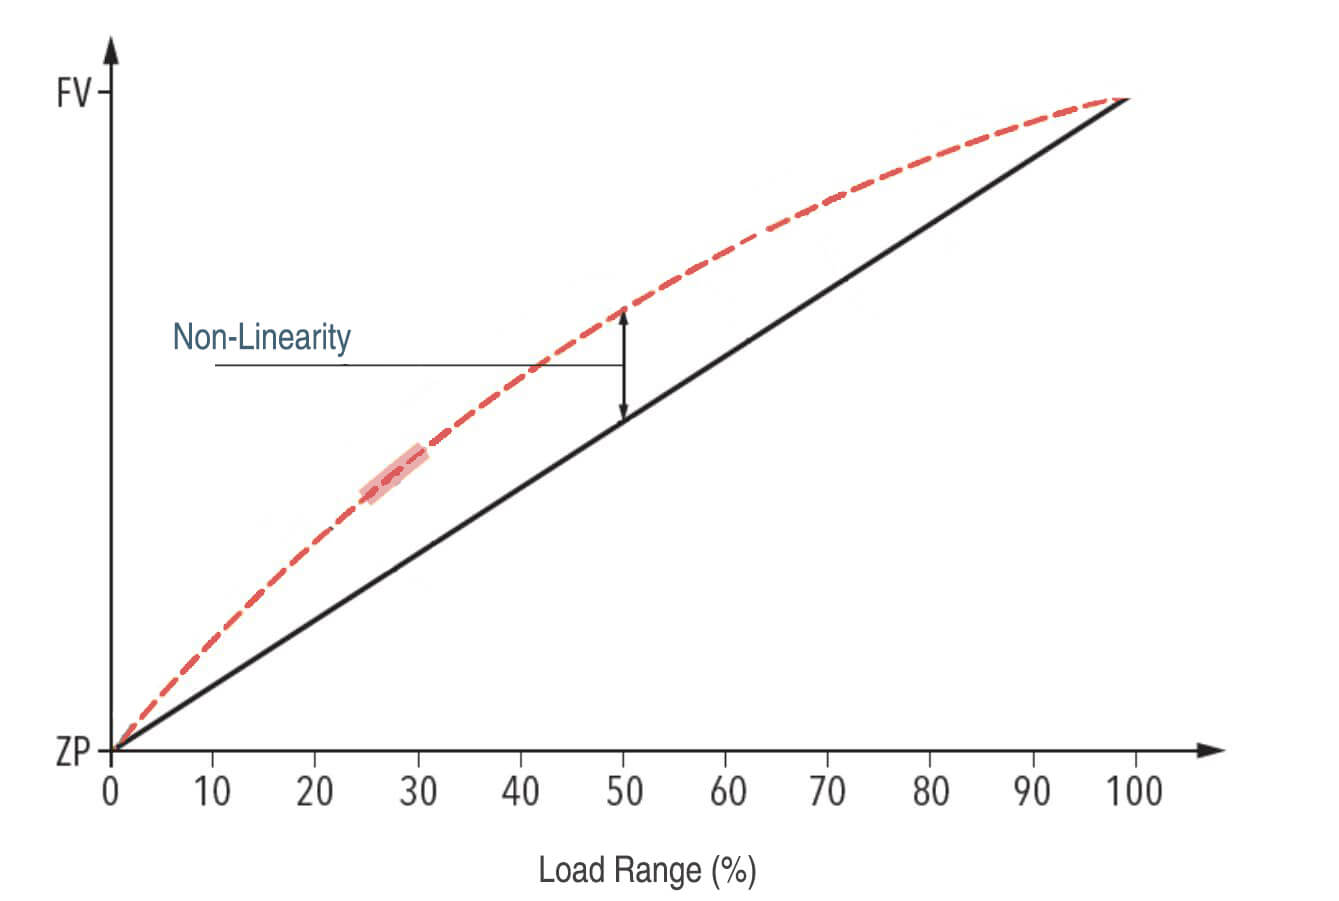
A perfectly linear sensor will provide a consistent output signal for a linear change in pressure. However, in reality, pressure sensors may exhibit some non-linearity, causing deviations from a straight line. Higher linearity ensures more accurate and precise measurements.
Temperature effects can also impact pressure sensor precision. Temperature variations can cause changes in the sensor’s sensitivity, offset, and zero drift, leading to measurement inaccuracies. To mitigate these effects, pressure sensors often incorporate temperature compensation techniques, such as using temperature sensors to adjust the output signal accordingly.
Additionally, the overall quality and manufacturing processes of a pressure sensor can greatly affect its precision. Factors such as component tolerances, calibration procedures, and stability over time contribute to the sensor’s precision. High-quality manufacturing practices and stringent quality control measures help ensure consistent and accurate pressure measurements.
The Relationship between Precision & Accuracy
Precision and Accuracy are two important concepts in measurement that are often used interchangeably but have distinct meanings.
Precision, refers to the degree of repeatability or consistency in a series of measurements. It measures the ability of a sensor to provide consistent results when the same quantity is measured repeatedly under the same conditions.
Precision is often expressed as a standard deviation or a range of values. A high precision sensor will have a small standard deviation, indicating that the measurements cluster closely around the mean value.
Accuracy, on the other hand, refers to how close a measured value is to the true or reference value. It represents the degree of conformity between the measured value and the actual value.
Accuracy is typically expressed as a percentage of the full-scale range or as an error value. For example, if a pressure sensor has an accuracy of ±1% of the full-scale range, it means that the measured value can deviate by a maximum of 1% from the true value.
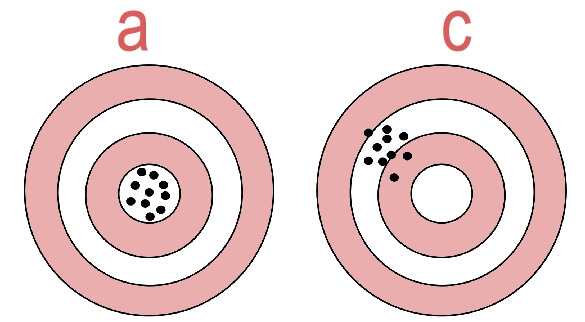
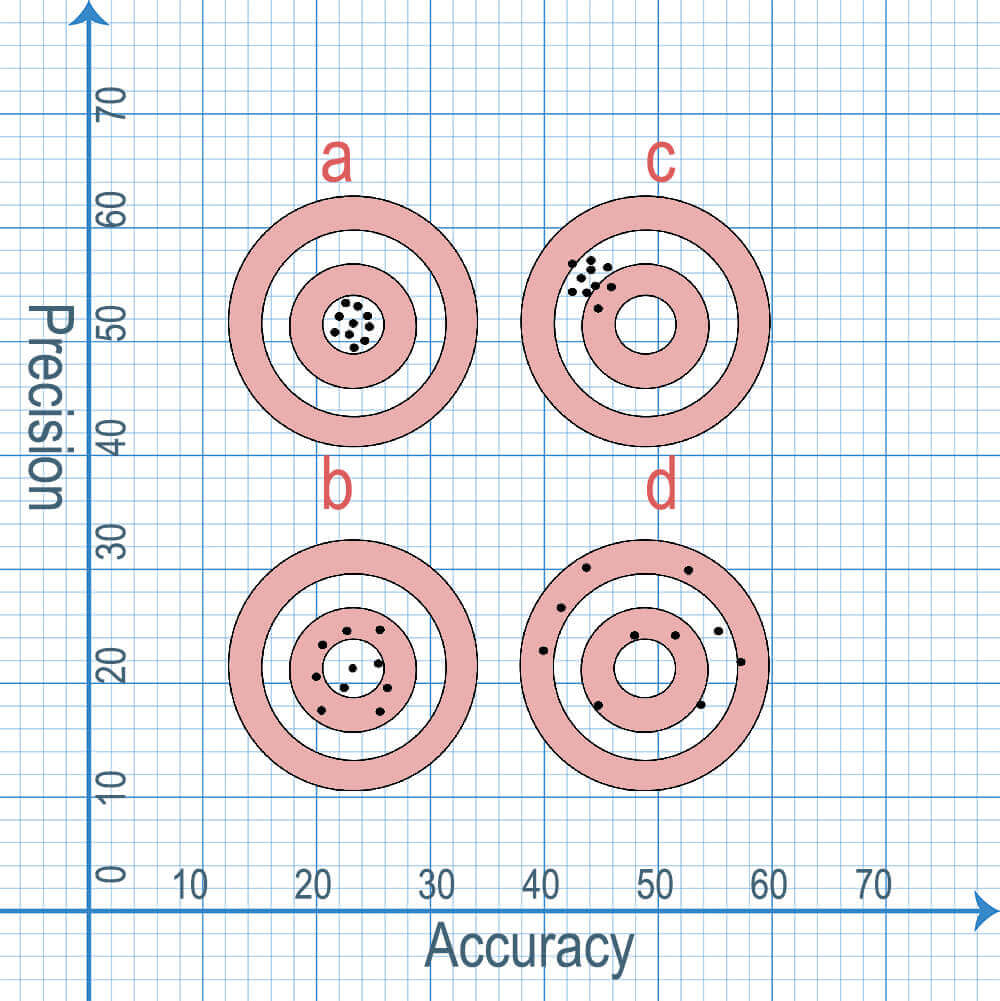
To understand the relationship between accuracy and precision, imagine a target with a bullseye at the center. Accuracy can be likened to hitting the bullseye, while precision is about hitting the same spot repeatedly, even if it is not the bullseye.
Here’s an illustration that may help:
In the above target, the measurements are scattered but near the true value, indicating good accuracy but poor precision (b).
The target has neither accuracy nor precision, and the fourth target demonstrates both good accuracy and good precision(d).
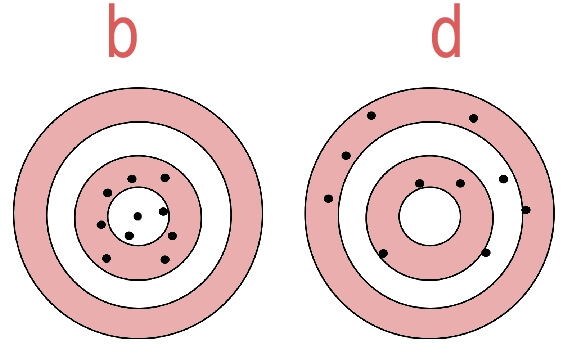
In the second target, the measurements are clustered together but far from the true value, indicating good precision but poor accuracy (c).
A measurement can be accurate but not precise (b) if it consistently deviates from the true value by the same amount. Conversely, a measurement can be precise but not accurate(c) if it consistently clusters around a different value than the true value.
In practice, both accuracy and precision are important in measurement. High accuracy ensures that the measured values are close to the true values, while high precision ensures that the measurements are consistent and reproducible.
Achieving both accuracy and precision requires careful calibration, quality control, and proper selection of measurement instruments (a).
It is important to note that accuracy and precision are not mutually exclusive. A measurement can be both accurate and precise, indicating that it is both close to the true value and consistent. However, a measurement can also be accurate but not precise, precise but not accurate, or neither accurate nor precise.
Accuracy vs Precision: Are They Interchangeable?
Accuracy and precision, although related, have distinct meanings in the context of measurements and are not interchangeable.
Accuracy refers to how close a measured value is to the actual (true) value. For example, if you’re aiming for a target, accuracy is described by how close your shots are to the target’s center.
Precision, on the other hand, refers to the consistency or repeatability of measurements, i.e., how close the measurements are to each other. In the target analogy, precision is described by how close together your shots are, regardless of their distance from the center of the target.
For a measurement system to be effective, it ideally needs to be both accurate (providing measurements close to the true value) and precise (providing consistent, repeatable measurements).
The Balancing Act: Achieving Both Accuracy and Precision
Balancing accuracy and precision ensure that pressure sensors provide measurements that are both close to the true value and consistent. This allows for reliable and trustworthy data collection, analysis, and decision-making.
To achieve this balance, normally we should consider factors as following:
- Sensor Calibration: One of the key challenges in maintaining accuracy and precision in pressure sensors is ensuring proper calibration. Calibration involves comparing the sensor’s output to a known reference value and adjusting it accordingly. Over time, pressure sensors can drift and lose accuracy due to factors such as aging, temperature variations, and mechanical stress. Regular calibration is necessary to correct any deviations and maintain accuracy and precision.
- Temperature Effects: Temperature changes can significantly affect the accuracy and precision of pressure sensors. Different materials used in the sensor’s construction can have varying coefficients of thermal expansion, leading to dimensional changes and potential measurement errors. Manufacturers provide temperature coefficients of sensitivity and zero point to quantify these effects. For example, a pressure sensor may have a sensitivity temperature coefficient of 0.1% per degree Celsius, indicating that the sensitivity changes by 0.1% for every degree Celsius change in temperature.
- Environmental Factors: Pressure sensors are often exposed to harsh environments that can impact their accuracy and precision. Factors such as humidity, vibration, shock, and electromagnetic interference can introduce errors in the measurements. Manufacturers provide specifications such as IP ratings and environmental limits to indicate the sensor’s resistance to these factors. For example, an IP67-rated sensor is protected against dust ingress and can withstand temporary immersion in water up to a depth of 1 meter.
- Linearity and Hysteresis: Linearity refers to how well the sensor’s output follows a straight line when the pressure changes linearly. Hysteresis refers to the difference in sensor output for the same pressure, depending on whether the pressure is increasing or decreasing. Non-linearity and hysteresis can affect the accuracy and precision of measurements. Manufacturers provide specifications such as linearity error and hysteresis error to quantify these effects. For example, a pressure sensor may have a linearity error of ±0.5% of the full-scale range, indicating that the measured value can deviate by a maximum of 0.5% from the ideal linear response.
- Signal Conditioning and Signal-to-Noise Ratio: The accuracy and precision of pressure sensors can be affected by the quality of the signal conditioning circuitry. Signal conditioning involves amplifying, filtering, and converting the sensor’s output signal to a usable form. Poor signal conditioning can introduce noise and distort the measurements. The signal-to-noise ratio (SNR) is a measure of the quality of the sensor’s output signal compared to the noise level. A higher SNR indicates better accuracy and precision.
- Long-term Stability: Maintaining long-term stability is another challenge in pressure sensor applications. Over time, pressure sensors can experience drift, where their output gradually changes even when there are no external factors affecting the measurement. Manufacturers provide specifications such as long-term stability or drift rate to indicate the sensor’s performance over time. For example, a pressure sensor may have a drift rate of ±0.1% of the full-scale range per year, indicating that the measured value can change by a maximum of 0.1% annually.
To address these challenges and maintain both accuracy and precision in pressure sensors, in practical, our engineers should consider the following:
- Selecting high-quality pressure sensors from reputable manufacturers with well-documented specifications.
- Ensuring regular calibration and maintenance of the sensors to correct any deviations and maintain accuracy.
- Providing proper environmental protection and considering the sensor’s resistance to factors such as temperature, humidity, vibration, and electromagnetic interference.
- Implementing effective signal conditioning techniques to minimize noise and maximize the signal-to-noise ratio.
- Monitoring long-term stability and drift of the sensors to detect any gradual changes in performance.
By understanding and addressing these challenges, we can ensure that pressure sensors provide accurate and precise measurements in various applications.
How to Evaluate the Accuracy and Precision
Interpreting Accuracy and Precision Data
To evaluate accuracy, we look at how close a measurement is to the true value. If a pressure gauge is accurate, it should show the known pressure of a fluid within a certain tolerance range. For example, a container known to hold a pressure of 10 bar might read as 9.95 to 10.05 bar on an accurate gauge.
Here’s an example:
- Known pressure = 10.00 bar
- Measurements from the gauge = [9.98, 10.01, 9.99, 10.02, 10.00]
- Average of measurements = 10.00 bar
- Accuracy = (Average of measurements / Known pressure) * 100% = 100%
In this case, the gauge is highly accurate because the average of the measurements is equal to the known pressure.
For precision, we look at how close the measurements are to each other. If a pressure gauge is precise, it should yield very similar readings for multiple measurements of the same fluid, even if the measurements aren’t necessarily close to the true pressure.
Using the same measurements from above:
- Standard deviation of measurements = 0.015 bar
- Precision = (1 – (Standard deviation / Average of measurements)) * 100% = 99.85%
In this case, the gauge is highly precise because the measurements are very close to each other.
Tips to Test and Validate Accuracy and Precision of Pressure Sensor
Testing and validating the accuracy and precision of a pressure sensor is crucial to ensure reliable and consistent measurements, let’s delve into the detailed process of testing and validating accuracy and precision of a pressure sensor:
Step 1: Select a Calibration Standard
The first step is to select a calibration standard. This should be a device whose accuracy is known and is significantly higher than that of the sensor you are testing.
For example, if you’re testing a sensor with an accuracy of ±0.1 bar, your calibration standard should ideally have an accuracy of ±0.01 bar or better.
Step 2: Define Your Testing Points
To thoroughly test your sensor, you should define several testing points across its entire operating range.
For instance, if your sensor has a range of 0 to 10 bar, you might select testing points at 0, 2.5, 5, 7.5, and 10 bar.
Step 3: Prepare Testing Environment
Ensure that the testing environment matches the conditions under which the sensor will operate. If the sensor will be used in a room temperature environment with minimal humidity, your testing environment should match these conditions as closely as possible.
Step 4: Conduct the Testing
Now, you’re ready to begin testing. For each point in your testing range, use your calibration standard to apply the target pressure to the sensor. Record the sensor’s reading. Repeat this process multiple times for each testing point — say, five times — to allow for an evaluation of precision.
For example, when testing at 5 bar, your readings might look like this:
| Target pressure | Reading 1 | Reading 2 | Reading 3 | Reading 4 | Reading 5 |
|---|---|---|---|---|---|
| 5 bar | 4.98 bar | 5.01 bar | 5.00 bar | 5.02 bar | 4.99 bar |
Step 5: Evaluate Accuracy
For each testing point, take the average of your recorded readings. Compare this to the target pressure. The closer the average is to the target, the more accurate your sensor.
For the example above, the average reading is 5.00 bar, which matches the target pressure — indicating high accuracy.
Step 6: Evaluate Precision
Calculate the standard deviation of your readings at each testing point. The smaller the standard deviation, the more precise your sensor. For the example above, the standard deviation might be 0.015 bar, indicating a high level of precision.
Step 7: Check for Systematic Errors
If your sensor’s average reading consistently deviates from the target pressure in one direction (i.e., it consistently reads too high or too low), this could indicate a systematic error. You might need to recalibrate the sensor to correct for this.
Step 8: Check for Random Errors
If your sensor’s readings have a high standard deviation, this could indicate random errors, possibly due to factors like electrical noise or fluctuations in environmental conditions. You might need to implement measures like signal filtering or shielding to reduce these errors.
Click for details: Pressure Senor Errors
Step 9: Repeat the Testing
To ensure the consistency of your sensor’s performance over time, repeat the testing process after a certain period — for instance, six months. Compare the results with the previous test to check for any drifts in accuracy or precision.
Step 10: Document Everything
Finally, you’ve to keep a detailed record of your testing process, including the conditions, the readings at each testing point, any errors identified, and any corrective actions taken. This will be invaluable for future testing and calibration efforts, and for troubleshooting any issues that might arise.
By following this step-by-step process, you can thoroughly test and validate the accuracy and precision of your pressure sensor, ensuring it’s fit for its intended application.
Conclusion
In conclusion, accuracy and precision are crucial aspects of pressure sensors. Accuracy relates to how close a sensor’s reading is to a known or true pressure value. Precision, on the other hand, measures the consistency of the sensor’s readings under the same conditions.
To validate these parameters, a calibration standard is used, which has a significantly higher known accuracy. The sensor is tested across its full operating range, and multiple readings are taken at each point to assess precision.
The mean and standard deviation of the readings provide insight into the sensor’s accuracy and precision, respectively. Any consistent deviation from the true value may indicate a systematic error, warranting recalibration. High standard deviation suggests random errors, potentially requiring solutions like signal filtering.
Repeat testing over time is necessary to monitor the sensor’s performance and track any drifts in accuracy or precision. Thorough documentation of the testing process aids in future calibration and troubleshooting. Ensuring the accuracy and precision of pressure sensors significantly contributes to their reliability in various applications.