Introduction
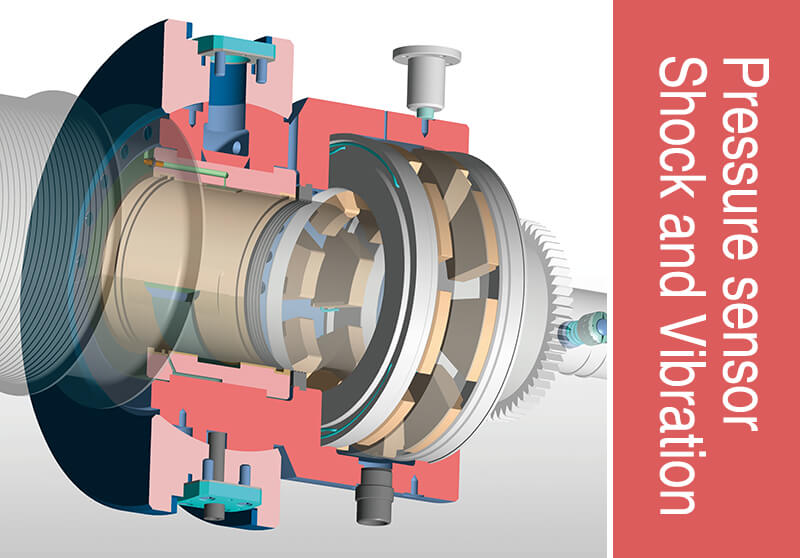
Shock and vibration can significantly influence the performance of pressure sensors, potentially leading to inaccurate readings or even premature sensor failure.
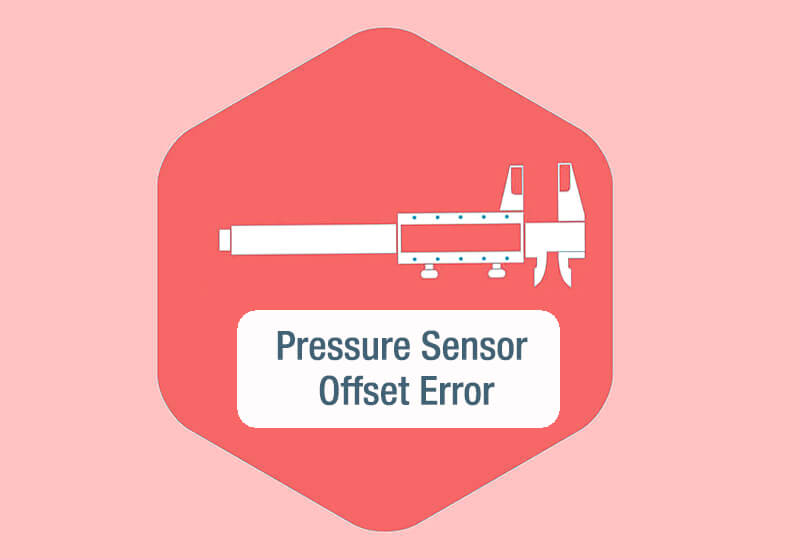
If a pressure sensor is subject to a shock beyond its rated capacity, it can lead to physical damage to the sensor elements or the electronic components. For example, a piezoresistive sensor, which works by changing resistance under pressure, might experience a permanent change in its base resistance after a severe shock, leading to an offset in all subsequent measurements.
On the other hand, when a sensor is exposed to vibration levels beyond its rated capacity, it can lead to drift in the sensor’s readings, increased noise, and reduced sensitivity. In extreme cases, continuous high-level vibration can lead to mechanical failure of the sensor components.
What is the difference between shock and vibration
Shock and vibration are different types of mechanical disturbances that can affect various devices and structures, including pressure sensors. Though they might seem similar, they are distinct in their nature, duration, and the ways they can impact a system.
Shock
Shock is a sudden, short duration disturbance or impulse that is usually caused by a rapid acceleration or deceleration.
It’s like a quick, strong jolt.
Shocks are typically caused by events like impacts, drops, or collisions.
The intensity of a shock is often described in terms of “g” force, where 1g equals the acceleration due to gravity (9.81 m/s²).
For example, a shock rating of 50g means the device can withstand a sudden force 50 times the gravitational acceleration without sustaining damage.
The duration of a shock event is typically very short, often in the range of microseconds to milliseconds.
Vibration
On the other hand, vibration is a continuous, oscillatory motion that happens back and forth around a reference point.
It’s like a steady, rhythmic shaking.
Vibration can be caused by rotating machinery, structural resonance, wind buffeting, and many other sources.
The intensity of vibration is described in terms of frequency (how many times the vibration occurs in a second, measured in Hertz, Hz) and amplitude (the size of the vibration, often described in “g” force).
For example, a vibration rating of 5g at 10-500 Hz means the device can handle continuous shaking with an amplitude of 5g over that frequency range without performance degradation.
While both shock and vibration can impact the performance of a pressure sensor, they affect the pressure sensor in different ways and thus, require different mitigation strategies.
How shock and vibration affect pressure sensor performance
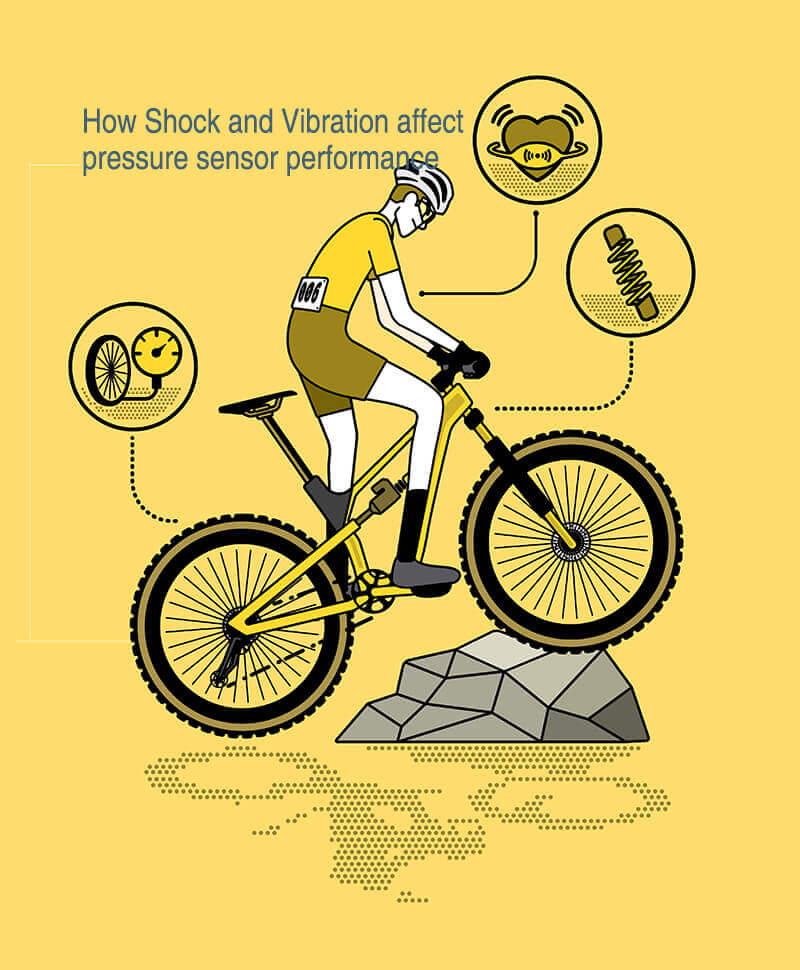
Shock and vibration can significantly impact the performance of pressure sensors, potentially leading to inaccurate readings or even premature sensor failure.
Firstly, shock refers to a sudden, high-impact force that the sensor might experience, often as a result of being dropped, hit, or when mounted on machinery that undergoes sudden movements.
A pressure sensor’s shock rating, usually given in ‘g’ units (1g = 9.81 m/s²), specifies the magnitude of shock it can withstand without damage or performance degradation.
For instance, a sensor with a shock rating of 100g can theoretically withstand an instantaneous acceleration or deceleration of 100 times the acceleration due to gravity without expected performance loss.
If a pressure sensor is subject to a shock beyond its rated capacity, it can lead to physical damage to the sensor elements or the electronic components.
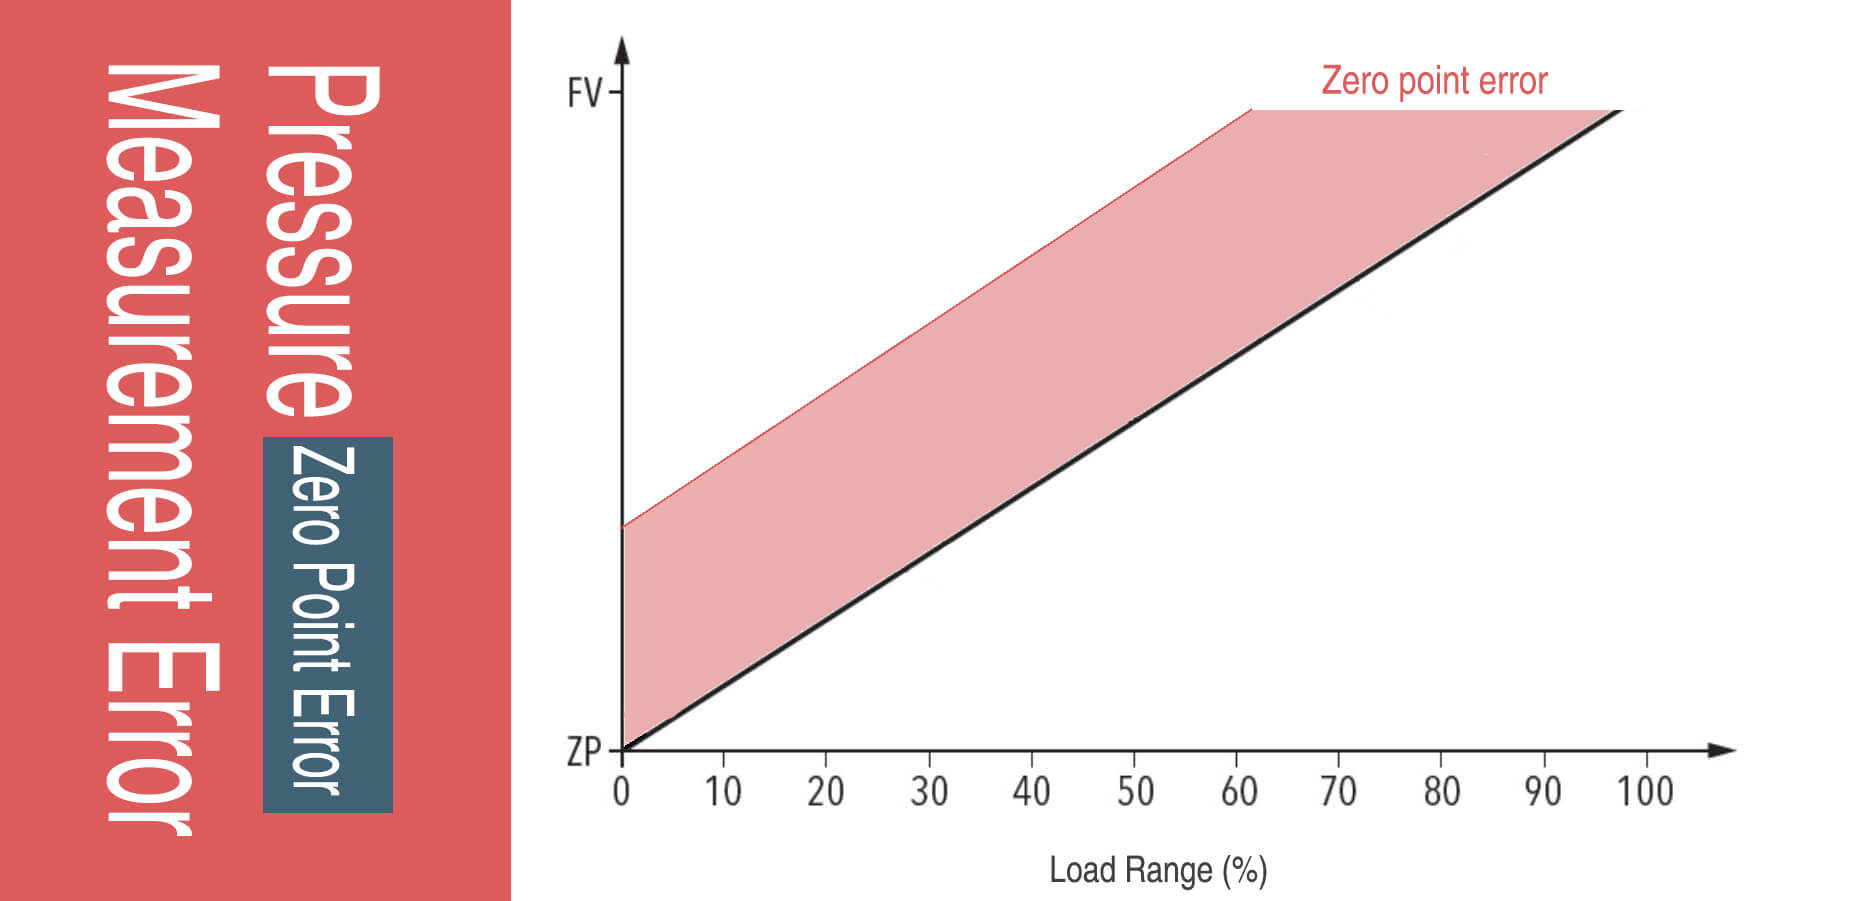
For example, a piezoresistive sensor, which works by changing resistance under pressure, might experience a permanent change in its base resistance after a severe shock, leading to an offset in all subsequent measurements.
Vibration, on the other hand, involves repeated or continuous oscillatory motion. It’s commonly encountered in industrial environments where the sensor might be mounted on machinery that vibrates during operation.
Vibration can cause mechanical stress and fatigue in the sensor components, leading to gradual deterioration over time.
The vibration rating of a sensor, typically given in terms of frequency (Hz) and amplitude (g), indicates the level of continuous vibration it can endure.
For example, a sensor with a vibration rating of 20g at 50-2000 Hz means it can withstand continuous vibration with an amplitude of 20g within that frequency range.
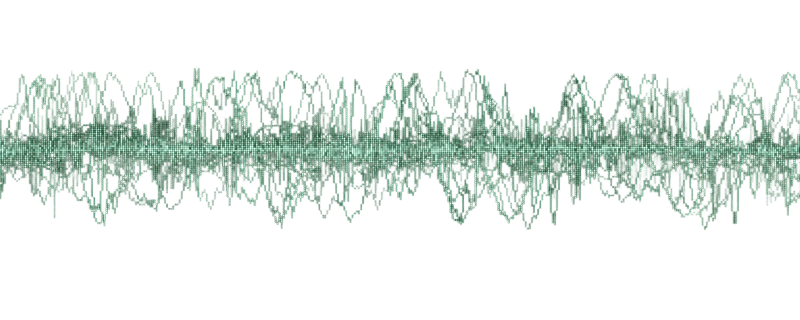
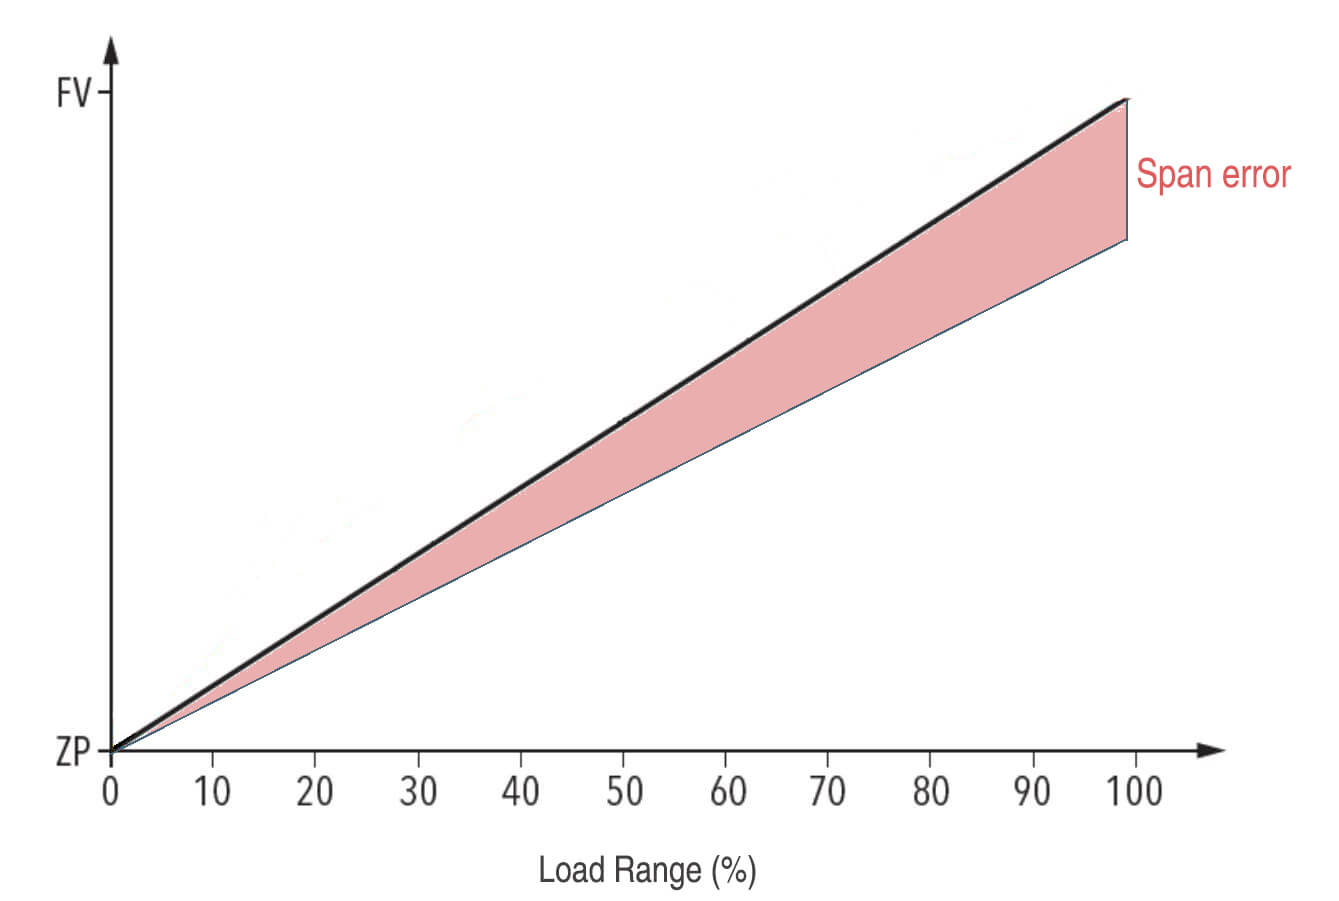
When a sensor is exposed to vibration levels beyond its rated capacity, it can lead to drift in the sensor’s readings, increased noise, and reduced sensitivity.
In extreme cases, continuous high-level vibration can lead to mechanical failure of the sensor components.
How to migrate the effect of shock and vibration lead to pressure sensor
To minimize the impacts of shock and vibration, measures such as the use of damping materials in the sensor mounting, a ruggedized sensor design, strategic sensor placement, and digital filtering techniques can be employed.
These methods are designed to ensure that the pressure sensor can deliver reliable and accurate performance, even under challenging conditions.
1, Use of Damping Materials:
Incorporating damping materials in the sensor mounting design can absorb and dissipate some of the energy from shock or vibration.
Damping materials for pressure sensor production can reduce the impact of shock and vibration on the sensor.
These materials can absorb and dissipate energy, minimizing the transfer of shock and vibration from the environment to the sensor itself.
These materials are often incorporated into the sensor’s mounting design or housing. They can be made from a variety of substances, such as certain types of rubber or viscoelastic compounds, which have properties that allow them to absorb energy and return slowly to their original shape after being deformed.
2, Ruggedized Design:
A pressure sensor can be designed with ruggedized components and a sturdy enclosure to withstand higher levels of shock and vibration. This could involve using thick-walled stainless steel for the sensor housing and high-strength alloys for the sensing elements.
A “ruggedized design” in the view of pressure sensor production also refers to the design and construction techniques used to make the sensor more resilient to harsh conditions, such as high levels of shock, vibration, temperature extremes, and harsh environmental conditions.
Here are a few elements often found in ruggedized design:
- Robust Housing:
- Sealed Enclosures:
- Enhanced Sensor Elements:
- Secure Connections:.
- Thick Circuitry:
- Overload Protection:
3, Location
The sensor should be installed in a location that minimizes exposure to shock and vibration.
For example, on a vibrating machine, the sensor should not be placed at locations with high amplitude vibrations.
4, Signal Processing
Techniques such as digital filtering can be used to reduce the noise caused by vibration in the sensor’s readings.
For instance, a low-pass filter could be used to remove high-frequency noise that is beyond the frequency range of the expected pressure signal.
5, Shock and Vibration Testing
Sensors should be thoroughly tested for shock and vibration resistance. Such testing often includes subjecting the sensor to specified levels of shock and vibration and measuring its performance. The data from these tests can be used to make design adjustments to improve resistance.
6, Redundancy
In critical applications, using multiple sensors and averaging their readings can help compensate for any inaccuracies caused by shock or vibration. This approach assumes that any errors introduced by these factors will be random and not systematically bias the readings of all sensors in the same direction.
7, Calibration
Regular calibration of the sensor can also help to correct for any drift or offset in the sensor’s readings caused by shock or vibration.
By utilizing these strategies, it’s possible to significantly reduce the negative effects of shock and vibration on pressure sensor performance, leading to more accurate and reliable measurements.
Wrap up
Shock and vibration can significantly affect the performance of pressure sensors. Shock refers to a sudden high-impact force that can cause physical damage to the sensor or create a permanent offset in its readings. Vibration, on the other hand, is a continuous oscillatory motion that can lead to increased noise in the sensor’s readings, reduced sensitivity, and mechanical failure over time.
To mitigate these effects, a variety of strategies can be employed. Damping materials can be used to absorb shock and vibration energy, and a ruggedized sensor design can increase the sensor’s resistance to these forces. Strategic sensor placement can minimize exposure to shock and vibration, and digital filtering techniques can reduce noise in the sensor’s readings. Regular shock and vibration testing can help identify potential issues early, and redundancy and regular calibration can help ensure accurate and reliable measurements even in the presence of shock and vibration.
Key Takeaways
- Shock and vibration can cause physical damage, measurement offset, measurement noise, and reduced sensitivity in pressure sensors.
- Damping materials, ruggedized designs, and strategic sensor placement can help protect sensors from shock and vibration.
- Digital filtering techniques can be used to reduce measurement noise caused by vibration.
- Regular shock and vibration testing, along with the use of redundancy and regular calibration, can help ensure accurate and reliable sensor performance even in challenging conditions.